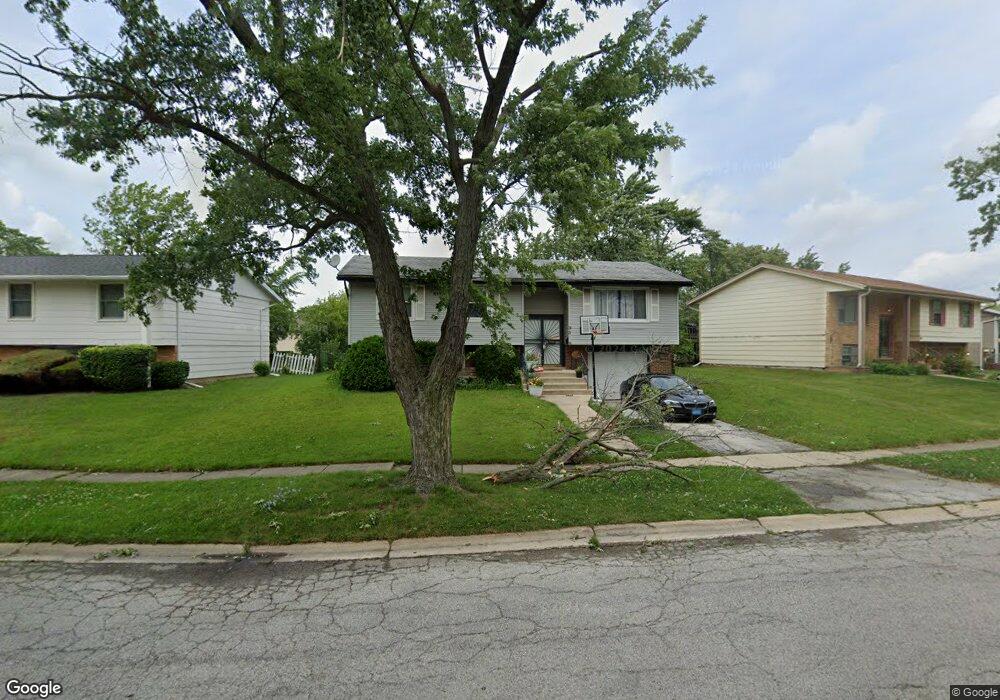
3316 Laurel Ln Hazel Crest, IL 60429
Estimated Value: $189,896 - $229,000
4
Beds
2
Baths
1,056
Sq Ft
$200/Sq Ft
Est. Value
About This Home
This home is located at 3316 Laurel Ln, Hazel Crest, IL 60429 and is currently estimated at $210,974, approximately $199 per square foot. 3316 Laurel Ln is a home located in Cook County with nearby schools including Highlands Elementary School, Prairie-Hills Junior High School, and Hillcrest High School.
Ownership History
Date
Name
Owned For
Owner Type
Purchase Details
Closed on
Feb 25, 2010
Sold by
Us Bank National Association
Bought by
Siepak Rick
Current Estimated Value
Purchase Details
Closed on
Oct 15, 2009
Sold by
Phillips Sean
Bought by
Us Bank National Association
Purchase Details
Closed on
Dec 31, 2002
Sold by
Williams Samuel and Williams Barbara
Bought by
Phillips Sean
Home Financials for this Owner
Home Financials are based on the most recent Mortgage that was taken out on this home.
Original Mortgage
$88,609
Interest Rate
6.13%
Mortgage Type
FHA
Purchase Details
Closed on
Jan 19, 1996
Sold by
Williams Barbara
Bought by
Williams Samuel and Williams Barbara
Home Financials for this Owner
Home Financials are based on the most recent Mortgage that was taken out on this home.
Original Mortgage
$88,000
Interest Rate
7.19%
Create a Home Valuation Report for This Property
The Home Valuation Report is an in-depth analysis detailing your home's value as well as a comparison with similar homes in the area
Home Values in the Area
Average Home Value in this Area
Purchase History
| Date | Buyer | Sale Price | Title Company |
|---|---|---|---|
| Siepak Rick | $55,000 | Git | |
| Us Bank National Association | -- | None Available | |
| Phillips Sean | $90,000 | -- | |
| Williams Samuel | -- | Lawyers Title Insurance Corp |
Source: Public Records
Mortgage History
| Date | Status | Borrower | Loan Amount |
|---|---|---|---|
| Previous Owner | Phillips Sean | $88,609 | |
| Previous Owner | Williams Samuel | $88,000 |
Source: Public Records
Tax History
| Year | Tax Paid | Tax Assessment Tax Assessment Total Assessment is a certain percentage of the fair market value that is determined by local assessors to be the total taxable value of land and additions on the property. | Land | Improvement |
|---|---|---|---|---|
| 2025 | $7,684 | $15,000 | $2,696 | $12,304 |
| 2024 | $7,684 | $15,000 | $2,696 | $12,304 |
| 2023 | $6,564 | $15,000 | $2,696 | $12,304 |
| 2022 | $6,564 | $8,942 | $2,281 | $6,661 |
| 2021 | $6,326 | $8,941 | $2,280 | $6,661 |
| 2020 | $6,006 | $8,941 | $2,280 | $6,661 |
| 2019 | $5,760 | $8,603 | $2,073 | $6,530 |
| 2018 | $5,582 | $8,603 | $2,073 | $6,530 |
| 2017 | $5,215 | $8,603 | $2,073 | $6,530 |
| 2016 | $4,221 | $7,220 | $1,866 | $5,354 |
| 2015 | $4,044 | $7,220 | $1,866 | $5,354 |
| 2014 | $3,944 | $7,220 | $1,866 | $5,354 |
| 2013 | $4,215 | $8,801 | $1,866 | $6,935 |
Source: Public Records
Map
Nearby Homes
- 3319 Tulip Dr
- 3321 Tulip Dr
- 3318 Tulip Dr
- 3312 Maple Ln
- 17007 Elm Dr
- 3214 Birchwood Dr
- 3316 Birchwood Dr
- 17113 Elm Dr
- 3425 Birchwood Dr
- 3511 Laurel Ln
- 3213 Woodworth Place
- 17206 Elm Dr
- 3509 Birchwood Dr
- 17005 Albany Ave Unit 102
- 3012 171st St Unit GT
- 17306 Burr Oak Ln
- 3321 173rd St
- 17006 Novak Dr Unit T107
- 3311 Hickory Ln
- 3107 173rd St
Your Personal Tour Guide
Ask me questions while you tour the home.