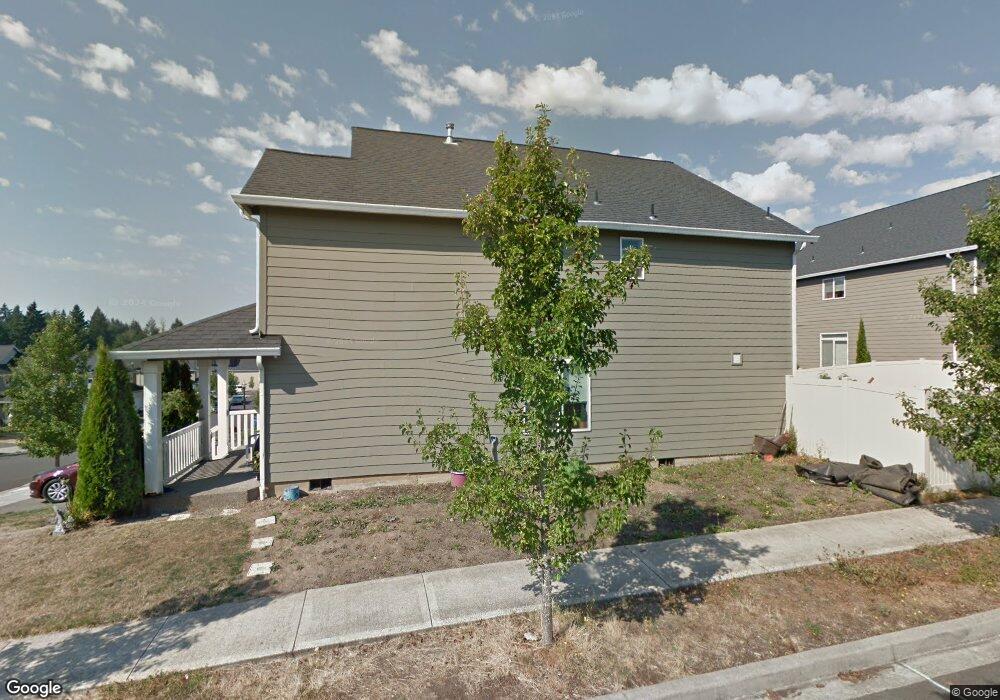
3316 S 2nd Way Ridgefield, WA 98642
Estimated Value: $537,000 - $549,000
4
Beds
3
Baths
2,418
Sq Ft
$225/Sq Ft
Est. Value
About This Home
This home is located at 3316 S 2nd Way, Ridgefield, WA 98642 and is currently estimated at $543,018, approximately $224 per square foot. 3316 S 2nd Way is a home located in Clark County with nearby schools including Ridgefield High School and Mountain View Christian School.
Ownership History
Date
Name
Owned For
Owner Type
Purchase Details
Closed on
Jul 27, 2016
Sold by
Williams Tracey L
Bought by
Williams Tracey L and Williams Phetmaia S
Current Estimated Value
Home Financials for this Owner
Home Financials are based on the most recent Mortgage that was taken out on this home.
Original Mortgage
$173,000
Outstanding Balance
$79,336
Interest Rate
3.54%
Mortgage Type
New Conventional
Estimated Equity
$463,682
Purchase Details
Closed on
Dec 7, 2005
Sold by
Williams Phetmala S
Bought by
Williams Tracey L
Home Financials for this Owner
Home Financials are based on the most recent Mortgage that was taken out on this home.
Original Mortgage
$25,000
Interest Rate
6.35%
Mortgage Type
Credit Line Revolving
Create a Home Valuation Report for This Property
The Home Valuation Report is an in-depth analysis detailing your home's value as well as a comparison with similar homes in the area
Home Values in the Area
Average Home Value in this Area
Purchase History
| Date | Buyer | Sale Price | Title Company |
|---|---|---|---|
| Williams Tracey L | -- | Clark County Title Company | |
| Williams Tracey L | -- | First American Title | |
| Williams Tracey | $230,125 | First American Title |
Source: Public Records
Mortgage History
| Date | Status | Borrower | Loan Amount |
|---|---|---|---|
| Open | Williams Tracey L | $173,000 | |
| Closed | Williams Tracey | $25,000 | |
| Closed | Williams Tracey L | $182,100 |
Source: Public Records
Tax History Compared to Growth
Tax History
| Year | Tax Paid | Tax Assessment Tax Assessment Total Assessment is a certain percentage of the fair market value that is determined by local assessors to be the total taxable value of land and additions on the property. | Land | Improvement |
|---|---|---|---|---|
| 2025 | $4,379 | $495,614 | $145,000 | $350,614 |
| 2024 | $4,212 | $494,239 | $145,000 | $349,239 |
| 2023 | $3,778 | $506,418 | $145,000 | $361,418 |
| 2022 | $3,531 | $434,748 | $104,423 | $330,325 |
| 2021 | $3,412 | $380,079 | $97,500 | $282,579 |
| 2020 | $3,417 | $343,581 | $91,000 | $252,581 |
| 2019 | $3,318 | $339,417 | $86,678 | $252,739 |
| 2018 | $3,406 | $332,958 | $0 | $0 |
| 2017 | $2,615 | $295,105 | $0 | $0 |
| 2016 | $2,407 | $267,673 | $0 | $0 |
| 2015 | $2,418 | $236,073 | $0 | $0 |
| 2014 | -- | $227,015 | $0 | $0 |
| 2013 | -- | $192,334 | $0 | $0 |
Source: Public Records
Map
Nearby Homes
- 3204 S 2nd Way
- 3150 S 3rd Way
- 2650 S 4th Way
- 4784 Pioneer St
- 3047 S Cedar Ridge Dr
- 251 N Green Gables Loop
- 208 N 30th Dr
- 1108 S 48th Place
- 252 N 30th Dr
- 2805 N 2nd Way
- 4523 S 39th Dr
- 4532 S 39th Dr
- 4517 S 39th Dr
- 4504 S 39th Dr
- 3505 N Pioneer Canyon Dr
- 3102 N Pioneer Canyon Dr
- 3012 N Pioneer Canyon Dr
- 204 N 38th Place
- 351 S 39th Dr
- 540 N Avery Dr