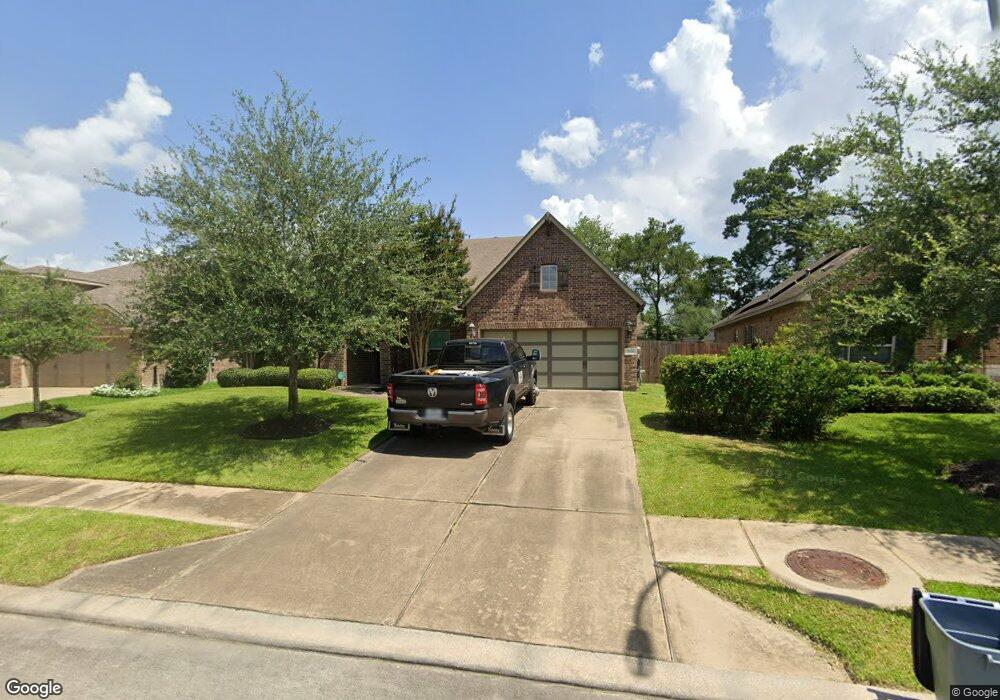
3316 Starlight Hill Ct Spring, TX 77386
Imperial Oaks NeighborhoodEstimated Value: $434,242 - $514,000
3
Beds
3
Baths
3,220
Sq Ft
$147/Sq Ft
Est. Value
About This Home
This home is located at 3316 Starlight Hill Ct, Spring, TX 77386 and is currently estimated at $473,311, approximately $146 per square foot. 3316 Starlight Hill Ct is a home located in Montgomery County with nearby schools including Birnham Woods Elementary School, York J High School, and Grand Oaks High School.
Ownership History
Date
Name
Owned For
Owner Type
Purchase Details
Closed on
Jan 31, 2019
Sold by
Griffiths Lyndsay and Griffiths Shane
Bought by
Keith Justin A
Current Estimated Value
Home Financials for this Owner
Home Financials are based on the most recent Mortgage that was taken out on this home.
Original Mortgage
$262,400
Outstanding Balance
$230,703
Interest Rate
4.6%
Mortgage Type
New Conventional
Estimated Equity
$242,608
Purchase Details
Closed on
Mar 14, 2014
Sold by
Weekley Homes Llc
Bought by
Griffiths Lyndsay Neely and Griffiths Shane Jonathan
Home Financials for this Owner
Home Financials are based on the most recent Mortgage that was taken out on this home.
Original Mortgage
$252,000
Interest Rate
4.27%
Mortgage Type
New Conventional
Purchase Details
Closed on
Apr 2, 2013
Sold by
Imperial Oaks Development Corp
Bought by
Griffiths Shane J and Griffiths Lyndsay N
Create a Home Valuation Report for This Property
The Home Valuation Report is an in-depth analysis detailing your home's value as well as a comparison with similar homes in the area
Home Values in the Area
Average Home Value in this Area
Purchase History
| Date | Buyer | Sale Price | Title Company |
|---|---|---|---|
| Keith Justin A | -- | Veritas Title Partners | |
| Griffiths Lyndsay Neely | -- | Priority Title | |
| Griffiths Shane J | -- | -- |
Source: Public Records
Mortgage History
| Date | Status | Borrower | Loan Amount |
|---|---|---|---|
| Open | Keith Justin A | $262,400 | |
| Closed | Griffiths Lyndsay Neely | $252,000 |
Source: Public Records
Tax History Compared to Growth
Tax History
| Year | Tax Paid | Tax Assessment Tax Assessment Total Assessment is a certain percentage of the fair market value that is determined by local assessors to be the total taxable value of land and additions on the property. | Land | Improvement |
|---|---|---|---|---|
| 2025 | $9,927 | $458,385 | $68,000 | $390,385 |
| 2024 | $9,927 | $454,000 | $68,000 | $386,000 |
| 2023 | $9,323 | $419,020 | $68,000 | $403,940 |
| 2022 | $10,762 | $380,930 | $28,270 | $391,730 |
| 2021 | $10,627 | $346,300 | $28,270 | $318,030 |
| 2020 | $10,529 | $324,560 | $28,270 | $296,290 |
| 2019 | $10,257 | $307,620 | $28,270 | $279,350 |
| 2018 | $8,911 | $286,930 | $28,270 | $258,660 |
| 2017 | $9,823 | $292,220 | $28,270 | $263,950 |
| 2016 | $9,823 | $292,220 | $28,270 | $263,950 |
| 2015 | $9,311 | $292,220 | $28,270 | $263,950 |
| 2014 | $9,311 | $275,320 | $28,270 | $247,050 |
Source: Public Records
Map
Nearby Homes
- 3317 Starlight Hill Ct
- 3301 Asbury Glen Ct
- 31563 Ember Trail Ln
- 31527 Reston Cliff Ct
- 31525 Ember Trail Ln
- 3417 Acacia Grove Ln
- 3267 Old Ironwood Dr
- 31920 Scarlet Tupelo Way
- 31402 Linden Springs Ct
- 31840 Pecan Cottage Ln
- 31848 Pecan Cottage Ln
- 31992 Retama Ranch Dr
- 31844 Pecan Cottage Ln
- 32015 Retama Ranch Ln
- 31972 Retama Ranch Ln
- 31993 Retama Ranch Ln
- 31992 Retama Ranch Ln
- 32027 Retama Ranch Ln
- 31996 Retama Ranch Ln
- 2898 Woodland Glen Ln
- 3316 Starlight Hill Ct
- 3312 Starlight Hill Ct
- 3320 Starlight Hill Ct
- 3313 Asbury Glen Ct
- 3317 Asbury Glen Ct
- 3324 Starlight Hill Ct
- 3309 Asbury Glen Ct
- 3330 Starlight Hill Ct
- 3321 Asbury Glen Ct
- 3308 Starlight Hill Ct
- 3328 Starlight Hill Ct
- 3305 Asbury Glen Ct
- 3304 Starlight Hill Ct
- 3325 Asbury Glen Ct
- 3309 Starlight Hill Ct
- 3321 Starlight Hill Ct
- 3329 Asbury Glen Ct
- 3332 Starlight Hill Ct
- 3305 Starlight Hill Ct
- 3325 Starlight Hill Ct