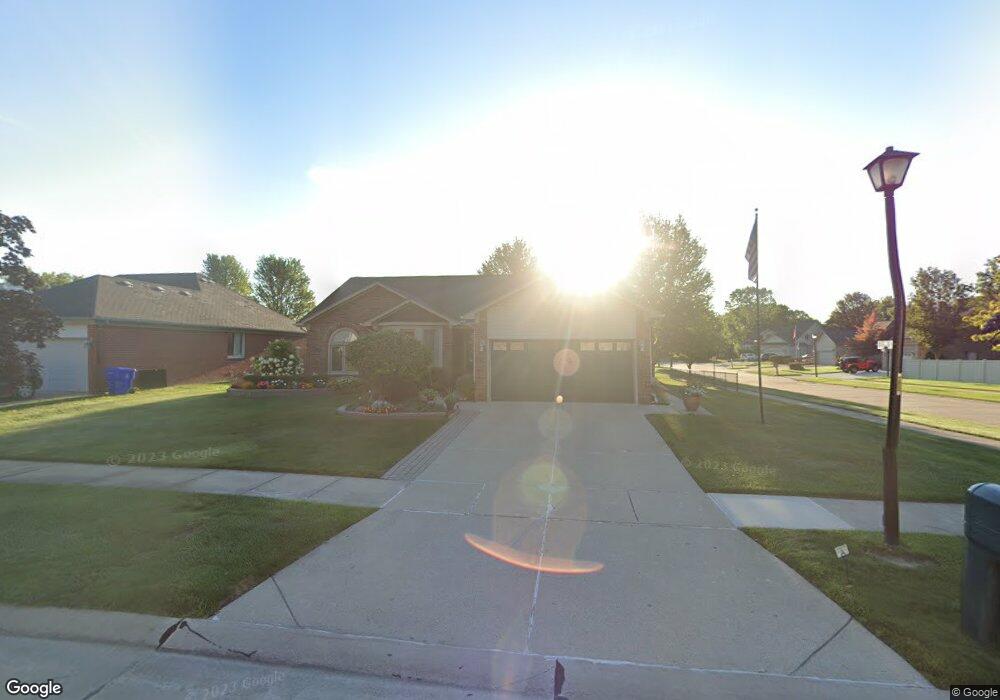
33164 Mazara Fraser, MI 48026
Estimated Value: $331,837 - $377,000
3
Beds
3
Baths
1,645
Sq Ft
$220/Sq Ft
Est. Value
About This Home
This home is located at 33164 Mazara, Fraser, MI 48026 and is currently estimated at $362,209, approximately $220 per square foot. 33164 Mazara is a home located in Macomb County with nearby schools including Ralph Waldo Emerson Elementary School, Richards Middle School, and Fraser High School.
Ownership History
Date
Name
Owned For
Owner Type
Purchase Details
Closed on
Apr 13, 2023
Sold by
Corbat Steven J and Corbat Linda Ann
Bought by
Linda A And Steven J Corbat Living Trust
Current Estimated Value
Purchase Details
Closed on
Feb 12, 2001
Sold by
Nadolsky David S
Bought by
Corbat Steven J
Home Financials for this Owner
Home Financials are based on the most recent Mortgage that was taken out on this home.
Original Mortgage
$165,000
Interest Rate
6.99%
Create a Home Valuation Report for This Property
The Home Valuation Report is an in-depth analysis detailing your home's value as well as a comparison with similar homes in the area
Home Values in the Area
Average Home Value in this Area
Purchase History
| Date | Buyer | Sale Price | Title Company |
|---|---|---|---|
| Linda A And Steven J Corbat Living Trust | -- | None Listed On Document | |
| Corbat Steven J | $224,500 | -- |
Source: Public Records
Mortgage History
| Date | Status | Borrower | Loan Amount |
|---|---|---|---|
| Previous Owner | Corbat Steven J | $165,000 |
Source: Public Records
Tax History
| Year | Tax Paid | Tax Assessment Tax Assessment Total Assessment is a certain percentage of the fair market value that is determined by local assessors to be the total taxable value of land and additions on the property. | Land | Improvement |
|---|---|---|---|---|
| 2025 | $4,469 | $163,600 | $0 | $0 |
| 2024 | $44 | $162,100 | $0 | $0 |
| 2023 | $4,178 | $140,300 | $0 | $0 |
| 2022 | $4,108 | $128,800 | $0 | $0 |
| 2021 | $4,063 | $127,700 | $0 | $0 |
| 2020 | $3,918 | $127,100 | $0 | $0 |
| 2019 | $3,715 | $114,600 | $0 | $0 |
| 2018 | $4,532 | $93,100 | $0 | $0 |
| 2017 | $3,890 | $91,457 | $29,727 | $61,730 |
| 2016 | $3,715 | $91,486 | $0 | $0 |
| 2015 | -- | $86,725 | $0 | $0 |
| 2013 | $3,156 | $72,883 | $0 | $0 |
| 2011 | -- | $80,628 | $20,946 | $59,682 |
Source: Public Records
Map
Nearby Homes
- 15801 Toulouse Unit 6
- 15743 Greenview
- 33710 Mulvey
- 15715 Exeter Ct
- 33420 Utica Rd
- 16572 Rosemary
- 34376 Giannetti Dr
- 15014 Arden Ave
- 15303 Lincolnshire Ln
- 33526 Duncan
- 32549 Gloede Dr
- 0 14 Mile Rd
- 31869 Grove
- 15657 Lauren
- 33555 Groth Dr
- 34495 Orsini Dr
- 34642 Giannetti Dr
- 34690 Clarkson Dr W Unit 27
- 34650 Clarkson Dr W Unit 43
- 16160 Clarkson Dr
Your Personal Tour Guide
Ask me questions while you tour the home.