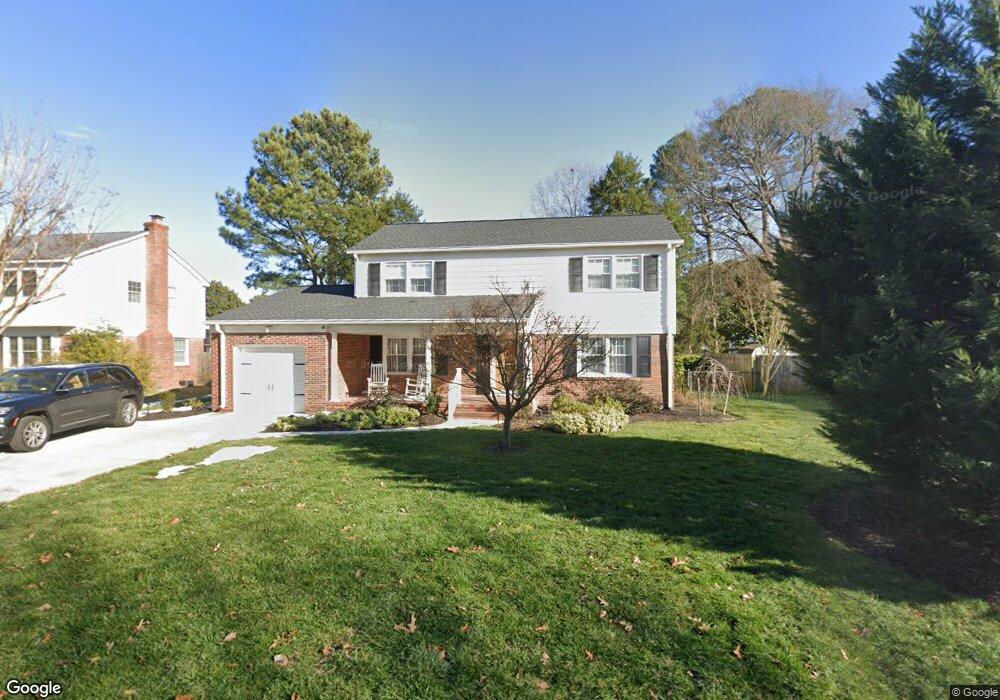
3317 Belmont Ct Virginia Beach, VA 23452
Little Neck NeighborhoodEstimated Value: $563,081 - $612,000
3
Beds
3
Baths
2,265
Sq Ft
$259/Sq Ft
Est. Value
About This Home
This home is located at 3317 Belmont Ct, Virginia Beach, VA 23452 and is currently estimated at $587,520, approximately $259 per square foot. 3317 Belmont Ct is a home located in Virginia Beach City with nearby schools including King's Grant Elementary School, Lynnhaven Middle School, and First Colonial High School.
Ownership History
Date
Name
Owned For
Owner Type
Purchase Details
Closed on
Mar 6, 2019
Sold by
The Estate Of Rosalyn Joyce Whitaker
Bought by
Holmstrom Charles H and Holmstrom Megan P
Current Estimated Value
Home Financials for this Owner
Home Financials are based on the most recent Mortgage that was taken out on this home.
Original Mortgage
$245,000
Outstanding Balance
$215,397
Interest Rate
4.4%
Mortgage Type
New Conventional
Estimated Equity
$372,123
Create a Home Valuation Report for This Property
The Home Valuation Report is an in-depth analysis detailing your home's value as well as a comparison with similar homes in the area
Home Values in the Area
Average Home Value in this Area
Purchase History
| Date | Buyer | Sale Price | Title Company |
|---|---|---|---|
| Holmstrom Charles H | $342,500 | Fidelity National Title |
Source: Public Records
Mortgage History
| Date | Status | Borrower | Loan Amount |
|---|---|---|---|
| Open | Holmstrom Charles H | $245,000 |
Source: Public Records
Tax History Compared to Growth
Tax History
| Year | Tax Paid | Tax Assessment Tax Assessment Total Assessment is a certain percentage of the fair market value that is determined by local assessors to be the total taxable value of land and additions on the property. | Land | Improvement |
|---|---|---|---|---|
| 2025 | $4,650 | $513,300 | $284,400 | $228,900 |
| 2024 | $4,650 | $479,400 | $284,400 | $195,000 |
| 2023 | $4,209 | $425,200 | $246,800 | $178,400 |
| 2022 | $4,027 | $406,800 | $235,000 | $171,800 |
| 2021 | $3,601 | $363,700 | $195,100 | $168,600 |
| 2020 | $3,800 | $373,500 | $195,100 | $178,400 |
| 2019 | $3,525 | $341,300 | $192,700 | $148,600 |
| 2018 | $3,422 | $341,300 | $192,700 | $148,600 |
| 2017 | $3,317 | $330,900 | $188,000 | $142,900 |
| 2016 | $3,279 | $331,200 | $188,000 | $143,200 |
| 2015 | $3,180 | $321,200 | $188,000 | $133,200 |
| 2014 | $2,865 | $327,100 | $190,400 | $136,700 |
Source: Public Records
Map
Nearby Homes
- 3124 Winchester Ln
- 1.42A Doncaster Rd
- 3113 Watergate Ln
- 3105 Quimby Rd
- 624 Nottingham Dr
- 479 N Lynnhaven Rd
- 876 Bishopsgate Ln
- 3004 Hampden Ln
- 500 Royal Palm Dr
- 892 Bishopsgate Ln
- 497 Baldwin St
- 2953 Bray Rd
- 405 Courtney Arch Unit X9072
- 916 Oxford Dr
- 728 Prince Charles Ln
- 457 Ingram Rd
- 390 Phyllis Ct
- 416 Baldwin St
- 3057 Belle Haven Dr
- 3532 Blue Marlin Cir
- 3313 Belmont Ct
- 3321 Belmont Ct
- 3316 Kensington St
- 3312 Kensington St
- 3309 Belmont Ct
- 3320 Kensington St
- 3325 Belmont Ct
- 3316 Belmont Ct
- 3308 Kensington St
- 3320 Belmont Ct
- 3312 Belmont Ct
- 3308 Belmont Ct
- 3305 Belmont Ct
- 3304 Kensington St
- 3324 Kensington St
- 732 Trio Ln
- 3304 Belmont Ct
- 3333 Old Kirkwood Dr
- 3309 Kensington St
- 3329 Old Kirkwood Dr