D
Seller's Agent in 2022
Daniel Lee
Stellar Real Estate, LLC
(214) 425-0703
1 in this area
38 Total Sales
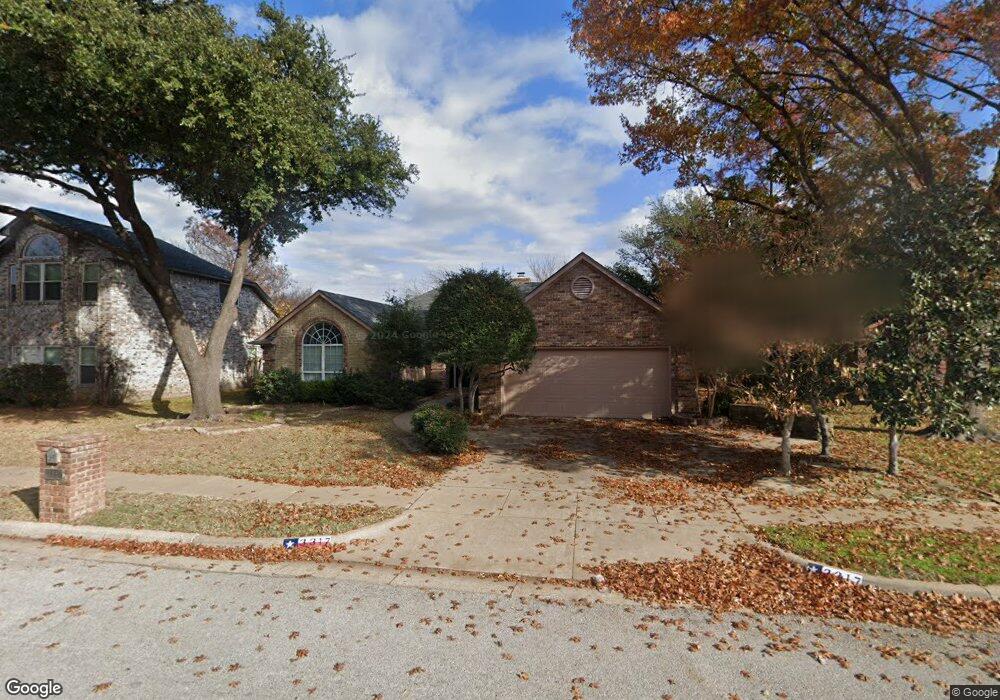
Estimated Value: $420,000 - $468,000
Charming single story home nestled in a great north Bedford neighborhood boasting award-winning HEB ISD. Inviting floor plan features traditional formal living & dining space. Oversized kitchen, walk-in pantry, cabinets galore & enough room to feed any size family which opens to family room. Both family room & master have access to the covered patio with no immediate neighbors behind. Master suite & secondary bedroom have ample space & are perfectly situated for more privacy. Owner is a licensed Texas Realtor Broker.
| Date | Buyer | Sale Price | Title Company |
|---|---|---|---|
| Ridgway Michael D | -- | None Available | |
| Ridgway Michael D | -- | None Available | |
| Lee Kyung Min | -- | None Available |
| Date | Status | Borrower | Loan Amount |
|---|---|---|---|
| Open | Lee Kyung Min | $191,250 |
| Date | Event | Price | List to Sale | Price per Sq Ft |
|---|---|---|---|---|
| 05/08/2022 05/08/22 | Rented | $2,700 | +3.8% | -- |
| 05/07/2022 05/07/22 | Off Market | $2,600 | -- | -- |
| 05/05/2022 05/05/22 | For Rent | $2,600 | -- | -- |
| Year | Tax Paid | Tax Assessment Tax Assessment Total Assessment is a certain percentage of the fair market value that is determined by local assessors to be the total taxable value of land and additions on the property. | Land | Improvement |
|---|---|---|---|---|
| 2025 | $8,460 | $434,517 | $90,000 | $344,517 |
| 2024 | $8,460 | $434,517 | $90,000 | $344,517 |
| 2023 | $8,548 | $445,650 | $60,000 | $385,650 |
| 2022 | $8,000 | $366,257 | $60,000 | $306,257 |
| 2021 | $7,706 | $327,121 | $60,000 | $267,121 |
| 2020 | $6,956 | $292,567 | $60,000 | $232,567 |
| 2019 | $6,993 | $294,384 | $60,000 | $234,384 |
| 2018 | $3,238 | $261,698 | $60,000 | $201,698 |
| 2017 | $5,755 | $242,902 | $26,000 | $216,902 |
| 2016 | $5,232 | $216,279 | $26,000 | $190,279 |
| 2015 | $3,257 | $207,800 | $26,000 | $181,800 |
| 2014 | $3,257 | $207,800 | $26,000 | $181,800 |
D
Seller's Agent in 2022
Daniel Lee
Stellar Real Estate, LLC
(214) 425-0703
1 in this area
38 Total Sales
A
Buyer's Agent in 2022
Anna Beth Browning
Nextgen Real Estate Properties
