Estimated Value: $268,200 - $289,000
--
Bed
2
Baths
1,794
Sq Ft
$156/Sq Ft
Est. Value
About This Home
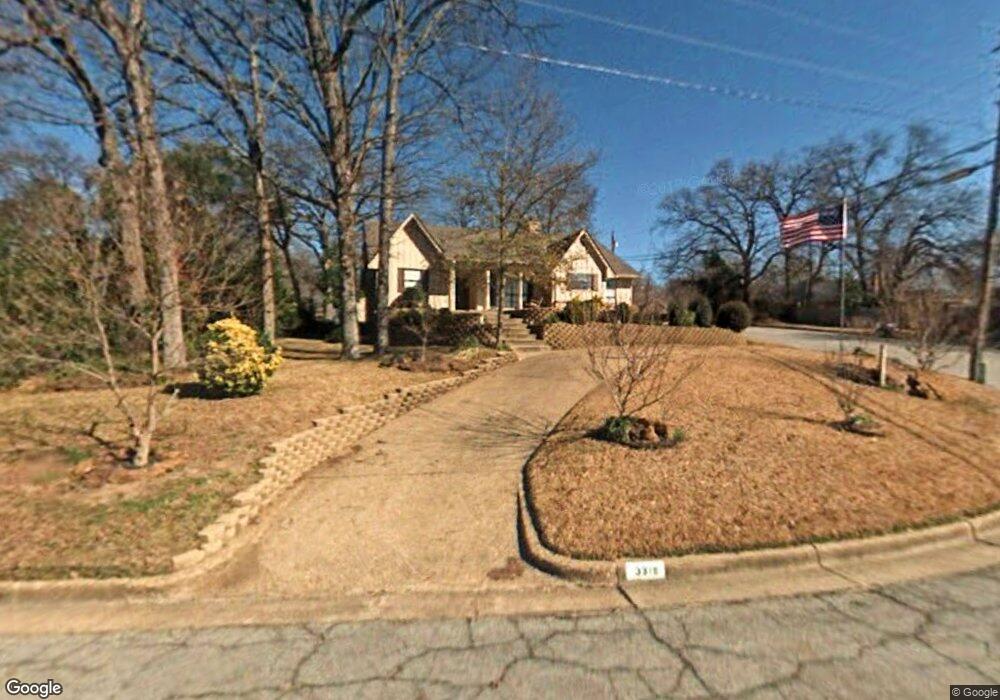
This home is located at 3318 Glendale Dr, Tyler, TX 75701 and is currently estimated at $280,300, approximately $156 per square foot. 3318 Glendale Dr is a home located in Smith County with nearby schools including Woods Elementary School, Hubbard Middle School, and Tyler Legacy High School.
Ownership History
Date
Name
Owned For
Owner Type
Purchase Details
Closed on
Feb 24, 2012
Sold by
Mcbridge Heather and Mcbride Arthur L
Bought by
Green Penny Renee and Goodwyn Penny Renee
Current Estimated Value
Home Financials for this Owner
Home Financials are based on the most recent Mortgage that was taken out on this home.
Original Mortgage
$48,554
Outstanding Balance
$33,239
Interest Rate
3.95%
Mortgage Type
Purchase Money Mortgage
Estimated Equity
$247,061
Purchase Details
Closed on
Oct 30, 2008
Sold by
White Max R and White Betty L
Bought by
Mcbride Heather and Beshears Priscilla
Home Financials for this Owner
Home Financials are based on the most recent Mortgage that was taken out on this home.
Original Mortgage
$167,489
Interest Rate
5.83%
Mortgage Type
FHA
Create a Home Valuation Report for This Property
The Home Valuation Report is an in-depth analysis detailing your home's value as well as a comparison with similar homes in the area
Home Values in the Area
Average Home Value in this Area
Purchase History
| Date | Buyer | Sale Price | Title Company |
|---|---|---|---|
| Green Penny Renee | -- | None Available | |
| Mcbride Heather | -- | None Available | |
| Mcbride Heather | -- | None Available |
Source: Public Records
Mortgage History
| Date | Status | Borrower | Loan Amount |
|---|---|---|---|
| Open | Green Penny Renee | $48,554 | |
| Previous Owner | Mcbride Heather | $167,489 |
Source: Public Records
Tax History Compared to Growth
Tax History
| Year | Tax Paid | Tax Assessment Tax Assessment Total Assessment is a certain percentage of the fair market value that is determined by local assessors to be the total taxable value of land and additions on the property. | Land | Improvement |
|---|---|---|---|---|
| 2025 | $2,599 | $267,306 | $84,218 | $183,088 |
| 2024 | $2,599 | $209,927 | $26,110 | $232,793 |
| 2023 | $3,327 | $236,442 | $26,110 | $210,332 |
| 2022 | $3,399 | $225,791 | $26,110 | $199,681 |
| 2021 | $3,309 | $157,722 | $14,920 | $142,802 |
| 2020 | $3,334 | $155,818 | $14,920 | $140,898 |
| 2019 | $3,298 | $150,824 | $14,920 | $135,904 |
| 2018 | $3,146 | $144,657 | $14,920 | $129,737 |
| 2017 | $3,086 | $144,657 | $14,920 | $129,737 |
| 2016 | $2,805 | $131,404 | $14,920 | $116,484 |
| 2015 | $2,451 | $126,427 | $14,920 | $111,507 |
| 2014 | $2,451 | $126,362 | $14,920 | $111,442 |
Source: Public Records
Map
Nearby Homes
- 3404 Silverwood Dr
- 3324 Teakwood Dr
- 3500 Silverwood Dr
- 3501 Silverwood Dr
- 1111 Beechwood Dr
- 3505 Cloverdale Dr
- 3518 Cloverdale Dr
- 3606 Glendale Dr
- 640 Beechwood Dr
- 3413 Iberville Dr
- 3425 Iberville Dr
- 3048 Concord Place
- 789 Fairmont Dr
- 3426 Bienville Dr
- 815 Woodland Hills Dr
- 3045 Concord Place
- 612 Rosemont Place II
- 701 Woodland Hills Dr
- 509 Buckingham Place
- 505 Buckingham Place
- 3310 Glendale Dr
- 3311 3311 Harwood
- 3311 Harwood Dr
- 3404 3404 Glendale
- 3404 Glendale Dr
- 3223 Fernwood Dr
- 3223 3223 Fernwood Dr
- 1011 Woodlark Dr
- 3403 Harwood Dr
- 3225 Fernwood Dr
- 3403 3403 Glendale
- 3403 Glendale Dr
- 3410 Glendale Dr
- 3219 3219 Fernwood
- 1015 Woodlark Dr
- 3312 3312 Harwood
- 3312 Harwood Dr
- 3405 3405 Harwood
- 3219 Fernwood Dr
- 3405 Harwood Dr