C
Seller's Agent in 2013
CINDI KRUSE
IN BETWEEN OFFICES

Estimated Value: $119,316 - $138,000
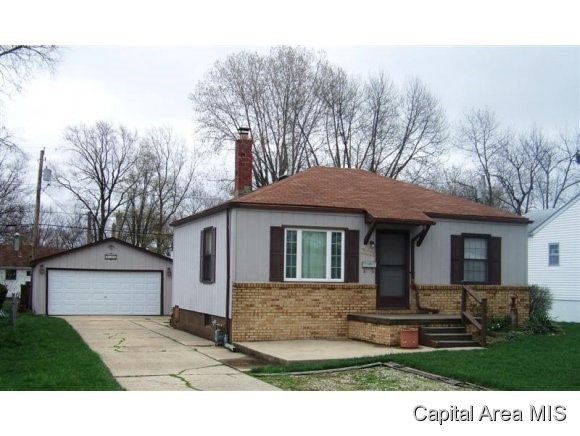
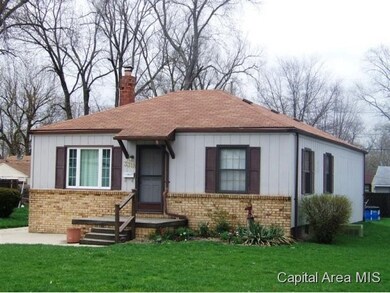
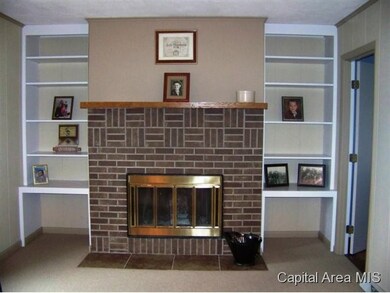
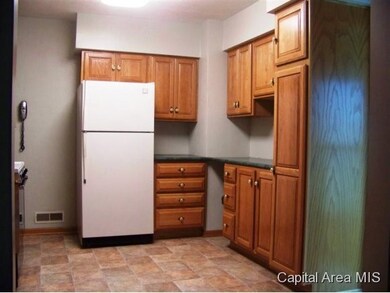
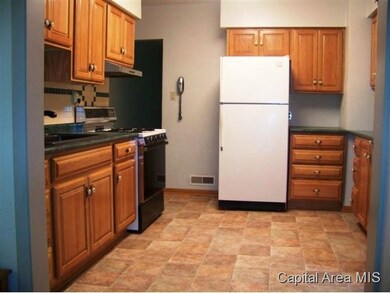
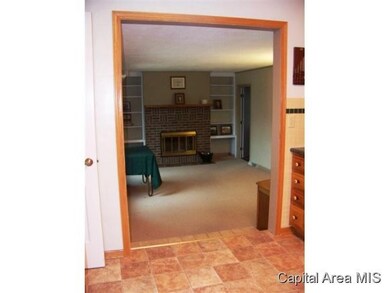
MOTIVATED SELLER!!! Priced BELOW below FMV! Much loved home w/updates throughout. Recent new flooring in kitchen & bath. Other improvements include trim, paint, hardwood floors (refinished & newer), PELLA windows, Schrock cabinets w/granite composite sink. Master addition has 9' ceilings! Cozy family room with woodburning fireplace. HUGE 4+ car detached garage~~perfect for the "man cave!" GREAT yard!
Last Agent to Sell the Property
CINDI KRUSE
IN BETWEEN OFFICES License #475102955 Listed on: 04/11/2013
| Date | Buyer | Sale Price | Title Company |
|---|---|---|---|
| -- | $83,000 | -- |
| Date | Event | Price | List to Sale | Price per Sq Ft |
|---|---|---|---|---|
| 08/30/2013 08/30/13 | Sold | $83,000 | -7.7% | $70 / Sq Ft |
| 07/29/2013 07/29/13 | Pending | -- | -- | -- |
| 04/11/2013 04/11/13 | For Sale | $89,900 | -- | $76 / Sq Ft |
| Year | Tax Paid | Tax Assessment Tax Assessment Total Assessment is a certain percentage of the fair market value that is determined by local assessors to be the total taxable value of land and additions on the property. | Land | Improvement |
|---|---|---|---|---|
| 2024 | $2,388 | $35,529 | $6,715 | $28,814 |
| 2023 | $2,311 | $32,898 | $6,218 | $26,680 |
| 2022 | $2,191 | $31,132 | $5,884 | $25,248 |
| 2021 | $2,095 | $29,911 | $5,653 | $24,258 |
| 2020 | $1,910 | $29,585 | $5,591 | $23,994 |
| 2019 | $1,435 | $29,067 | $5,493 | $23,574 |
| 2018 | $1,768 | $28,942 | $5,469 | $23,473 |
| 2017 | $1,719 | $28,497 | $5,385 | $23,112 |
| 2016 | $1,655 | $27,761 | $5,246 | $22,515 |
| 2015 | $1,614 | $27,135 | $5,128 | $22,007 |
| 2014 | $1,583 | $26,909 | $5,085 | $21,824 |
| 2013 | $1,856 | $27,197 | $5,139 | $22,058 |
C
Seller's Agent in 2013
CINDI KRUSE
IN BETWEEN OFFICES

Buyer's Agent in 2013
KATHY GARST
The Real Estate Group, Inc.
(217) 306-6063
762 Total Sales
Source: RMLS Alliance
MLS Number: RMACA131877
APN: 22-14.0-129-012
Disclaimer: Certain information contained herein is derived from information provided by parties other than Homes.com. All information provided is deemed reliable, but is not guaranteed to be accurate and should be independently verified.
![]() Based on information submitted to the MLS GRID. All data is obtained from various sources and may not have been verified by broker or MLS GRID. Supplied Open House Information is subject to change without notice. All information should be independently reviewed and verified for accuracy. Properties may or may not be listed by the office/agent presenting the information. Some IDX listings have been excluded from this website.IDX information is provided exclusively for personal, non-commercial use, and may not be used for any purpose other than to identify prospective properties consumers may be interested in purchasing. Information is deemed reliable but not guaranteed.
Based on information submitted to the MLS GRID. All data is obtained from various sources and may not have been verified by broker or MLS GRID. Supplied Open House Information is subject to change without notice. All information should be independently reviewed and verified for accuracy. Properties may or may not be listed by the office/agent presenting the information. Some IDX listings have been excluded from this website.IDX information is provided exclusively for personal, non-commercial use, and may not be used for any purpose other than to identify prospective properties consumers may be interested in purchasing. Information is deemed reliable but not guaranteed.
Based on information submitted to the MLS GRID
Ask me questions while you tour the home.