
Landlord's Agent in 2023
Milton Payton
RE/MAX 10
(708) 351-6675
36 Total Sales

Estimated Value: $173,000 - $238,000
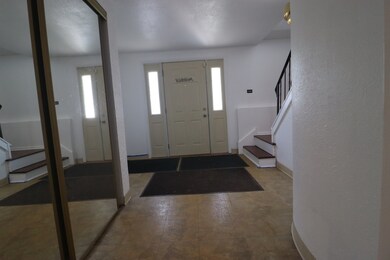
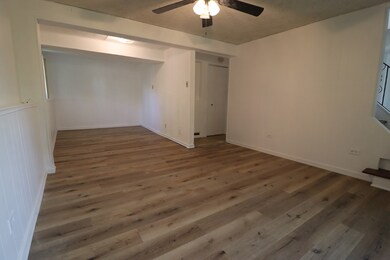
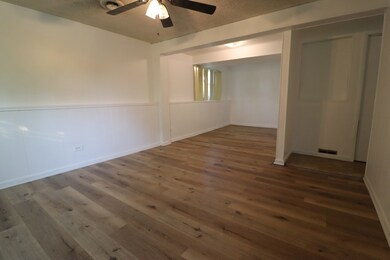
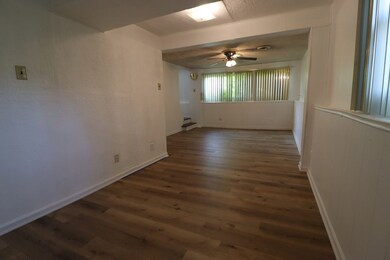
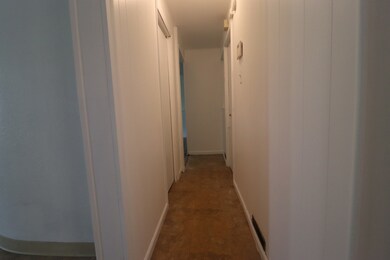
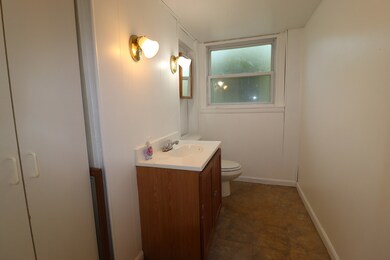
Happiness is right at home in this fine residental cul-de-sac home that recently had a magnificient face lift. Offering hardwood & tile flooring, formal dining room, 3 spacious bedrooms, deck off dinning room with large yard for summer entertainment, charming family room for family fun. A home designed for a comfortable lifestyle, just waiting on you. Near major expressways.
| Date | Buyer | Sale Price | Title Company |
|---|---|---|---|
| Haskin Leonard M | -- | -- |
| Date | Status | Borrower | Loan Amount |
|---|---|---|---|
| Closed | Haskin Leonard M | $100,000 |
| Date | Event | Price | List to Sale | Price per Sq Ft |
|---|---|---|---|---|
| 10/25/2023 10/25/23 | Rented | $2,100 | 0.0% | -- |
| 09/02/2023 09/02/23 | For Rent | $2,100 | +40.0% | -- |
| 11/28/2016 11/28/16 | Rented | $1,500 | 0.0% | -- |
| 11/05/2016 11/05/16 | Under Contract | -- | -- | -- |
| 09/26/2016 09/26/16 | For Rent | $1,500 | 0.0% | -- |
| 09/13/2016 09/13/16 | Off Market | $1,500 | -- | -- |
| 08/24/2016 08/24/16 | For Rent | $1,500 | 0.0% | -- |
| 08/17/2016 08/17/16 | Off Market | $1,500 | -- | -- |
| 08/12/2016 08/12/16 | For Rent | $1,500 | -- | -- |
| Year | Tax Paid | Tax Assessment Tax Assessment Total Assessment is a certain percentage of the fair market value that is determined by local assessors to be the total taxable value of land and additions on the property. | Land | Improvement |
|---|---|---|---|---|
| 2025 | $7,171 | $14,000 | $2,609 | $11,391 |
| 2024 | $7,171 | $14,000 | $2,609 | $11,391 |
| 2023 | $6,541 | $14,000 | $2,609 | $11,391 |
| 2022 | $6,541 | $8,912 | $2,208 | $6,704 |
| 2021 | $3,948 | $8,910 | $2,207 | $6,703 |
| 2020 | $3,901 | $8,910 | $2,207 | $6,703 |
| 2019 | $3,429 | $8,551 | $2,007 | $6,544 |
| 2018 | $3,319 | $8,551 | $2,007 | $6,544 |
| 2017 | $3,137 | $8,551 | $2,007 | $6,544 |
| 2016 | $2,836 | $7,347 | $1,806 | $5,541 |
| 2015 | $2,646 | $7,347 | $1,806 | $5,541 |
| 2014 | $2,611 | $7,347 | $1,806 | $5,541 |
| 2013 | $2,782 | $8,438 | $1,806 | $6,632 |
Landlord's Agent in 2023
Milton Payton
RE/MAX 10
(708) 351-6675
36 Total Sales
M
Landlord's Co-Listing Agent in 2023
Marilyn Payton
RE/MAX 10
(708) 351-6674
26 Total Sales
Tenant's Agent in 2023
Angelito Santos
Baird Warner
(630) 746-4536
2 in this area
58 Total Sales
E
Buyer's Agent in 2016
Elizabeth Washington
Elizabeth A Washington
Source: Midwest Real Estate Data (MRED)
MLS Number: 11872745
APN: 28-26-207-015-0000
Disclaimer: Certain information contained herein is derived from information provided by parties other than Homes.com. All information provided is deemed reliable, but is not guaranteed to be accurate and should be independently verified.
![]() Based on information submitted to the MLS GRID. All data is obtained from various sources and may not have been verified by broker or MLS GRID. Supplied Open House Information is subject to change without notice. All information should be independently reviewed and verified for accuracy. Properties may or may not be listed by the office/agent presenting the information. Some IDX listings have been excluded from this website.
Based on information submitted to the MLS GRID. All data is obtained from various sources and may not have been verified by broker or MLS GRID. Supplied Open House Information is subject to change without notice. All information should be independently reviewed and verified for accuracy. Properties may or may not be listed by the office/agent presenting the information. Some IDX listings have been excluded from this website.
Based on information submitted to the MLS GRID
Ask me questions while you tour the home.