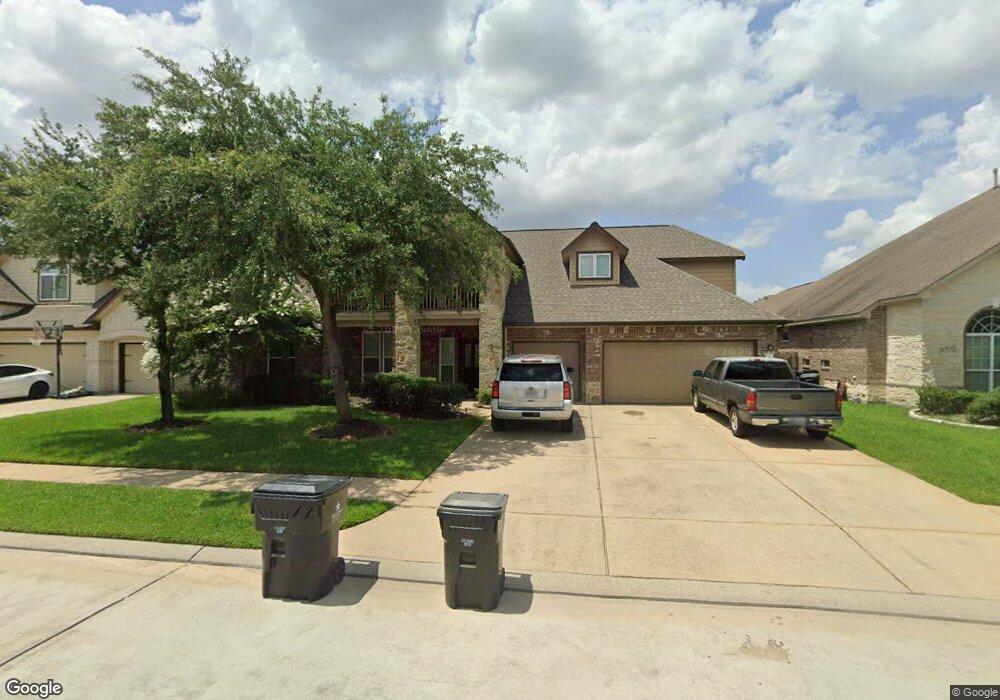
3319 Rosemary Trace Dr Spring, TX 77386
Estimated Value: $446,038 - $477,000
4
Beds
4
Baths
3,602
Sq Ft
$127/Sq Ft
Est. Value
About This Home
This home is located at 3319 Rosemary Trace Dr, Spring, TX 77386 and is currently estimated at $459,010, approximately $127 per square foot. 3319 Rosemary Trace Dr is a home located in Montgomery County with nearby schools including Bradley Elementary School, York J High School, and Grand Oaks High School.
Ownership History
Date
Name
Owned For
Owner Type
Purchase Details
Closed on
Mar 6, 2014
Sold by
Lassiter John and Lassiter Heather
Bought by
Horne Sharon J and Horne Lynn D
Current Estimated Value
Home Financials for this Owner
Home Financials are based on the most recent Mortgage that was taken out on this home.
Original Mortgage
$235,200
Outstanding Balance
$69,591
Interest Rate
4.44%
Mortgage Type
New Conventional
Estimated Equity
$389,419
Purchase Details
Closed on
Apr 17, 2013
Sold by
Legend Classic Homes Ltd
Bought by
Lassiter John
Home Financials for this Owner
Home Financials are based on the most recent Mortgage that was taken out on this home.
Original Mortgage
$271,217
Interest Rate
3.55%
Mortgage Type
FHA
Purchase Details
Closed on
Oct 10, 2012
Sold by
Legends Trace Interests Ltd
Bought by
Horne Lynn D and Horne Sharon J
Create a Home Valuation Report for This Property
The Home Valuation Report is an in-depth analysis detailing your home's value as well as a comparison with similar homes in the area
Home Values in the Area
Average Home Value in this Area
Purchase History
| Date | Buyer | Sale Price | Title Company |
|---|---|---|---|
| Horne Sharon J | -- | Chicago Title | |
| Lassiter John | -- | Lch Title Co | |
| Horne Lynn D | -- | -- | |
| Horne Lynn D | -- | -- |
Source: Public Records
Mortgage History
| Date | Status | Borrower | Loan Amount |
|---|---|---|---|
| Open | Horne Sharon J | $235,200 | |
| Previous Owner | Horne Lynn D | $271,217 |
Source: Public Records
Tax History Compared to Growth
Tax History
| Year | Tax Paid | Tax Assessment Tax Assessment Total Assessment is a certain percentage of the fair market value that is determined by local assessors to be the total taxable value of land and additions on the property. | Land | Improvement |
|---|---|---|---|---|
| 2025 | $9,651 | $450,467 | $38,194 | $412,273 |
| 2024 | $8,784 | $416,405 | -- | -- |
| 2023 | $8,784 | $378,550 | $38,190 | $418,460 |
| 2022 | $10,273 | $344,140 | $38,190 | $315,810 |
| 2021 | $10,007 | $312,850 | $38,190 | $274,660 |
| 2020 | $9,507 | $286,000 | $38,190 | $247,810 |
| 2019 | $9,504 | $280,000 | $38,190 | $241,810 |
| 2018 | $8,987 | $284,000 | $38,190 | $245,810 |
| 2017 | $9,788 | $287,760 | $38,190 | $249,570 |
| 2016 | $10,681 | $314,000 | $38,190 | $275,810 |
| 2015 | $9,191 | $294,000 | $38,190 | $255,810 |
| 2014 | $9,191 | $268,580 | $38,190 | $230,390 |
Source: Public Records
Map
Nearby Homes
- 30706 Legends Ridge Dr
- 30723 Wisteria Trace Dr
- 30723 Academy Trace Dr
- 30806 Academy Trace Dr
- 30802 Lavender Trace Dr
- 30415 Avera Creek Dr
- 3320 Atwood Creek Ct
- 31778 Twin Timbers Ln
- 3523 Tulip Trace Dr
- 30915 Still Oaks Ln
- 31011 Imperial Walk Ln
- 2954 Smokey Forest Ln
- 3002 Rusty Bridge Ct
- 3402 Legends Mist Dr
- 3604 Magnolia Crest Ln
- 3215 Legends Mist Dr
- 3119 Felton Springs Dr
- 30507 Woodson Trace Dr
- 3131 Rustic Gardens Dr
- 3518 Leaf Vines Dr
- 3315 Rosemary Trace Dr
- 3323 Rosemary Trace Dr
- 3314 Orchid Trace Dr
- 3322 Orchid Trace Dr
- 3327 Rosemary Trace Dr
- 3311 Rosemary Trace Dr
- 3314 Rose Trace Dr
- 30731 Wisteria Trace Dr
- 3310 Orchid Trace Dr
- 3326 Orchid Trace Dr
- 3331 Rosemary Trace Dr
- 3306 Orchid Trace Dr
- 30727 Wisteria Trace Dr
- 3319 Orchid Trace Dr
- 30719 Basil Trace Dr
- 3315 Orchid Trace Dr
- 3323 Orchid Trace Dr
- 3330 Orchid Trace Dr
- 3311 Orchid Trace Dr
- 30718 Basil Trace Dr