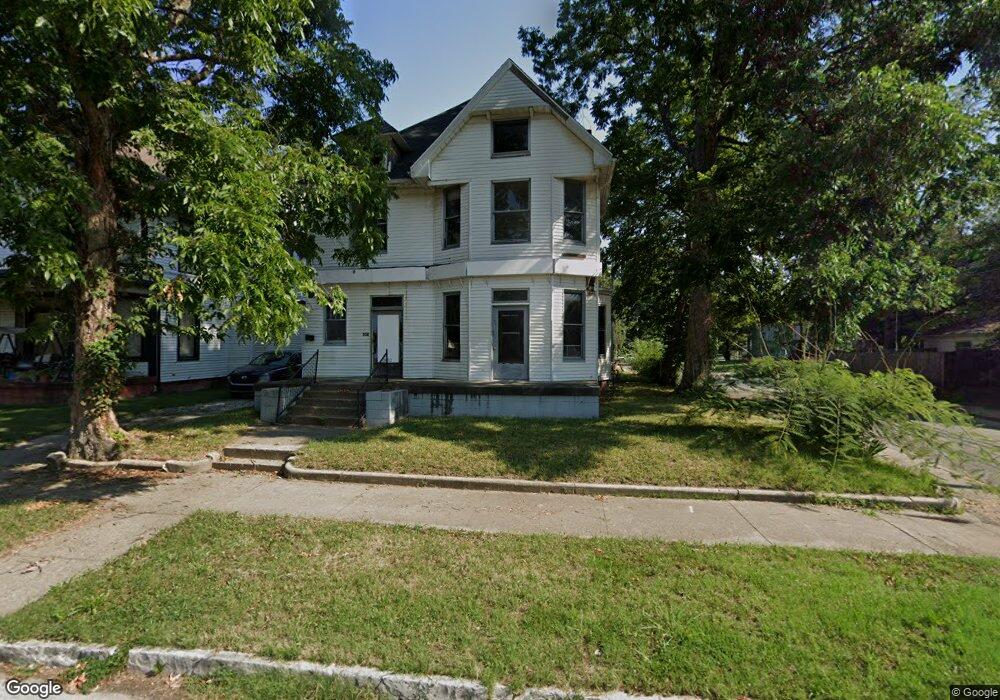
332 Adams Ave Evansville, IN 47713
Estimated Value: $82,000 - $173,396
4
Beds
2
Baths
4,448
Sq Ft
$32/Sq Ft
Est. Value
About This Home
This home is located at 332 Adams Ave, Evansville, IN 47713 and is currently estimated at $142,599, approximately $32 per square foot. 332 Adams Ave is a home located in Vanderburgh County with nearby schools including Benjamin Bosse High School, Glenwood Leadership Academy, and Signature School.
Ownership History
Date
Name
Owned For
Owner Type
Purchase Details
Closed on
Feb 27, 2024
Sold by
Petersen Lauren
Bought by
Smith Kyles
Current Estimated Value
Purchase Details
Closed on
Sep 8, 2023
Sold by
Brown Cody
Bought by
Smith Kyler and Petersen Louren
Purchase Details
Closed on
Sep 28, 2021
Sold by
Pinnacle Properties Llc
Bought by
Brown Cody
Purchase Details
Closed on
Nov 16, 2020
Sold by
Home America Fund Iii Lp
Bought by
Pinnacle Properties Llc
Purchase Details
Closed on
Apr 10, 2014
Sold by
Home America Llc
Bought by
Home America Fund Iii Lp
Purchase Details
Closed on
Aug 1, 2013
Sold by
Fannie Mae
Bought by
Home America Llc
Purchase Details
Closed on
Dec 20, 2012
Sold by
Kirsch Ronald H
Bought by
Federal National Mortgage Association and Fanni Mae
Purchase Details
Closed on
Jul 1, 2010
Sold by
Kirsch Glenna J
Bought by
Kirsch Ronald H
Purchase Details
Closed on
May 11, 2005
Sold by
Pathway Financial Services Inc
Bought by
Kirsh Ronald H
Create a Home Valuation Report for This Property
The Home Valuation Report is an in-depth analysis detailing your home's value as well as a comparison with similar homes in the area
Home Values in the Area
Average Home Value in this Area
Purchase History
| Date | Buyer | Sale Price | Title Company |
|---|---|---|---|
| Smith Kyles | $1,000 | None Listed On Document | |
| Smith Kyler | $1,000 | None Listed On Document | |
| Brown Cody | -- | None Available | |
| Pinnacle Properties Llc | $28,000 | None Available | |
| Home America Fund Iii Lp | -- | -- | |
| Home America Llc | -- | -- | |
| Federal National Mortgage Association | $73,449 | None Available | |
| Kirsch Ronald H | -- | None Available | |
| Kirsh Ronald H | -- | None Available |
Source: Public Records
Tax History Compared to Growth
Tax History
| Year | Tax Paid | Tax Assessment Tax Assessment Total Assessment is a certain percentage of the fair market value that is determined by local assessors to be the total taxable value of land and additions on the property. | Land | Improvement |
|---|---|---|---|---|
| 2024 | $2,285 | $105,900 | $9,100 | $96,800 |
| 2023 | $1,137 | $102,600 | $9,100 | $93,500 |
| 2022 | $2,249 | $103,000 | $9,100 | $93,900 |
| 2021 | $2,116 | $95,200 | $9,100 | $86,100 |
| 2020 | $1,546 | $71,200 | $9,100 | $62,100 |
| 2019 | $1,537 | $71,200 | $9,100 | $62,100 |
| 2018 | $2,321 | $71,200 | $9,100 | $62,100 |
| 2017 | $1,539 | $70,600 | $9,100 | $61,500 |
| 2016 | $1,548 | $70,900 | $9,100 | $61,800 |
| 2014 | $1,530 | $70,000 | $9,100 | $60,900 |
| 2013 | -- | $70,600 | $9,100 | $61,500 |
Source: Public Records
Map
Nearby Homes
- 314 Jefferson Ave
- 423 Jefferson Ave
- 308 Madison Ave
- 511 Washington Ave
- 926 S Elliott St
- 605 & 607 Washington Ave
- 600 & 602 Washington Ave
- 929 S Garvin St
- 523 Jefferson Ave
- 917 S Garvin St
- 608 Jefferson Ave
- 612 Adams Ave
- 110 Jefferson Ave
- 614 Washington Ave
- 622 Adams Ave
- 613 Madison Ave
- 1318 S Governor St
- 1320 S Governor St
- 625 Madison Ave
- 1105 S Linwood Ave
- 328 Adams Ave
- 324 Adams Ave
- 402 Adams Ave
- 313 Washington Ave
- 320 Adams Ave
- 404 Adams Ave
- 309 Washington Ave
- 327 Adams Ave
- 403 Washington Ave
- 305 Washington Ave
- 331 Adams Ave
- 401 Adams Ave Unit 403
- 408 Adams Ave
- 301 Washington Ave
- 316 Adams Ave
- 321 Adams Ave
- 407 Adams Ave
- 319 Adams Ave
- 409 Adams Ave
- 412 Adams Ave