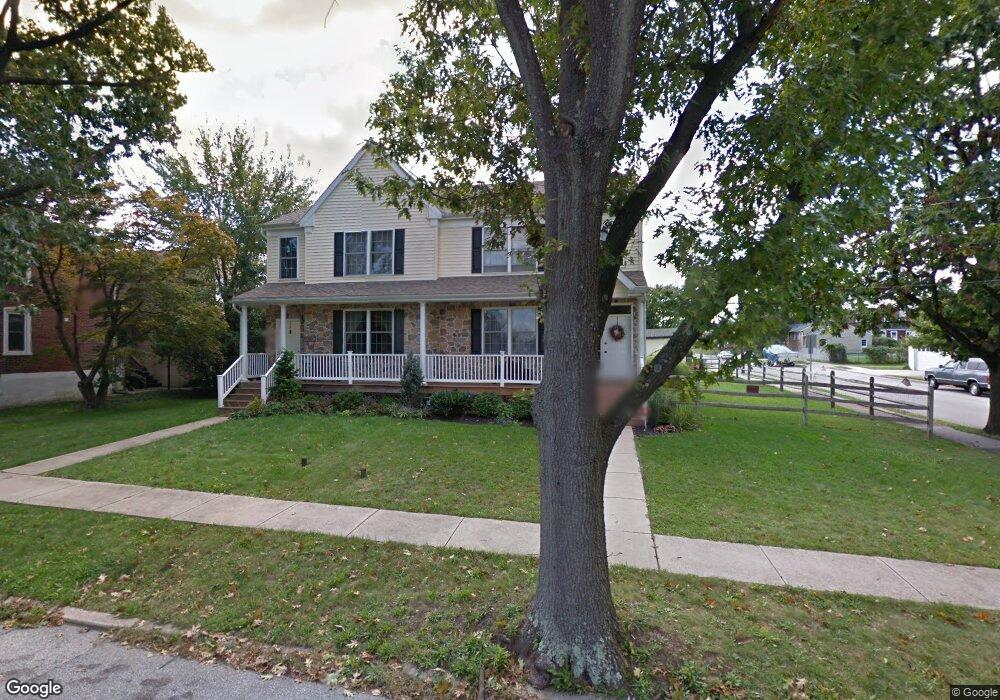
332 Ann St Phoenixville, PA 19460
Estimated Value: $361,000 - $466,513
3
Beds
3
Baths
1,656
Sq Ft
$252/Sq Ft
Est. Value
About This Home
This home is located at 332 Ann St, Phoenixville, PA 19460 and is currently estimated at $417,878, approximately $252 per square foot. 332 Ann St is a home located in Chester County with nearby schools including Barkley Elelemtary School, Phoenixville Area Middle School, and Phoenixville Area High School.
Ownership History
Date
Name
Owned For
Owner Type
Purchase Details
Closed on
Sep 28, 2012
Sold by
Thomas Justin and Chilla Christine
Bought by
Finley John F and Finley Genevieve L
Current Estimated Value
Purchase Details
Closed on
Mar 18, 2008
Sold by
Hastings Investment Co Inc
Bought by
Finley John F and Finley Genevieve L
Home Financials for this Owner
Home Financials are based on the most recent Mortgage that was taken out on this home.
Original Mortgage
$223,198
Interest Rate
5.75%
Mortgage Type
FHA
Create a Home Valuation Report for This Property
The Home Valuation Report is an in-depth analysis detailing your home's value as well as a comparison with similar homes in the area
Home Values in the Area
Average Home Value in this Area
Purchase History
| Date | Buyer | Sale Price | Title Company |
|---|---|---|---|
| Finley John F | -- | None Available | |
| Finley John F | $225,000 | Fidelity Natl Title Ins Co |
Source: Public Records
Mortgage History
| Date | Status | Borrower | Loan Amount |
|---|---|---|---|
| Previous Owner | Finley John F | $223,198 |
Source: Public Records
Tax History Compared to Growth
Tax History
| Year | Tax Paid | Tax Assessment Tax Assessment Total Assessment is a certain percentage of the fair market value that is determined by local assessors to be the total taxable value of land and additions on the property. | Land | Improvement |
|---|---|---|---|---|
| 2025 | $5,974 | $130,160 | $31,490 | $98,670 |
| 2024 | $5,974 | $130,160 | $31,490 | $98,670 |
| 2023 | $5,842 | $130,160 | $31,490 | $98,670 |
| 2022 | $5,753 | $130,160 | $31,490 | $98,670 |
| 2021 | $5,671 | $130,160 | $31,490 | $98,670 |
| 2020 | $5,441 | $130,160 | $31,490 | $98,670 |
| 2019 | $5,340 | $130,160 | $31,490 | $98,670 |
| 2018 | $5,188 | $130,160 | $31,490 | $98,670 |
| 2017 | $5,109 | $130,160 | $31,490 | $98,670 |
| 2016 | $516 | $130,160 | $31,490 | $98,670 |
| 2015 | $516 | $130,160 | $31,490 | $98,670 |
| 2014 | $516 | $130,160 | $31,490 | $98,670 |
Source: Public Records
Map
Nearby Homes
- 355 Emmett St
- 110 Saint Marys St
- 47 Grant St
- 26 Grant St
- 1124 Utley Alley
- 21 Grant St
- 1 Penn St
- 1046 Balley Dr Unit K2
- 1041 Balley Dr Unit E4
- 414 Heckle St
- 1031 Balley Dr Unit F3
- 17 Cromby Rd
- 1017 Balley Dr Unit G3
- Holley Plan at Steelpointe
- 420 Lopata Rd
- 958 Skylar Ct
- 235 Bridge St
- 1006 Seminick Alley
- 787 Ore St
- 252 Smithworks Blvd