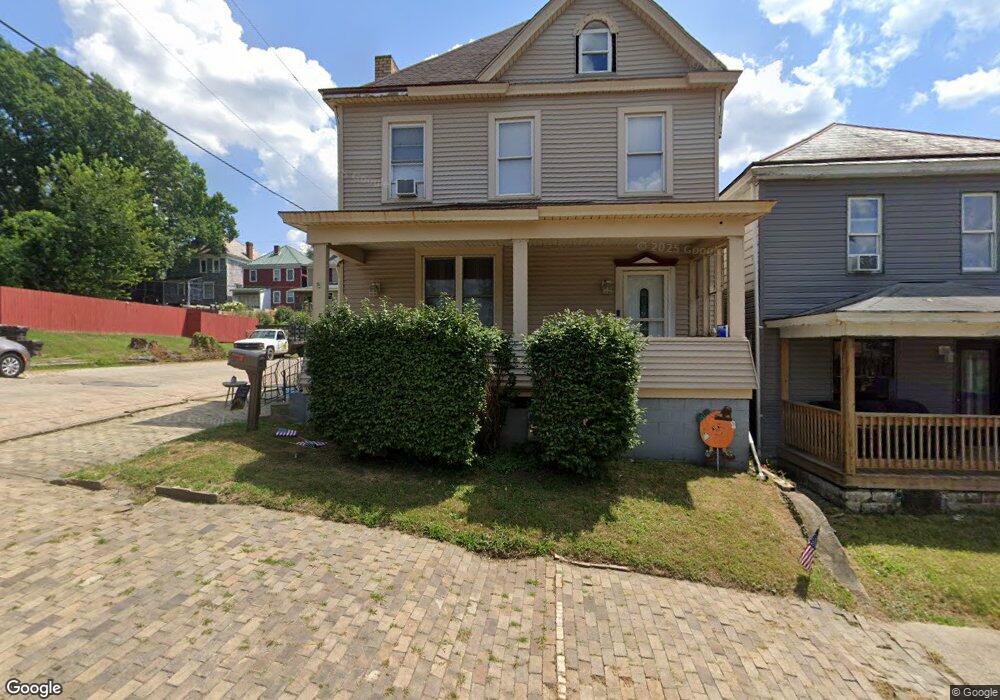
332 Blakely St East Liverpool, OH 43920
Estimated Value: $67,000 - $88,000
3
Beds
2
Baths
1,678
Sq Ft
$44/Sq Ft
Est. Value
About This Home
This home is located at 332 Blakely St, East Liverpool, OH 43920 and is currently estimated at $73,803, approximately $43 per square foot. 332 Blakely St is a home located in Columbiana County with nearby schools including Westgate Middle School, North Elementary School, and East Liverpool High School.
Ownership History
Date
Name
Owned For
Owner Type
Purchase Details
Closed on
Sep 29, 2003
Sold by
Doak Arthur T and Doak Lynda M
Bought by
Miller Ernest D and Belt Kandace R
Current Estimated Value
Home Financials for this Owner
Home Financials are based on the most recent Mortgage that was taken out on this home.
Original Mortgage
$58,500
Outstanding Balance
$27,655
Interest Rate
6.4%
Mortgage Type
Purchase Money Mortgage
Estimated Equity
$46,148
Purchase Details
Closed on
May 19, 1995
Sold by
Bangor Constance
Bought by
Doak Arthur T and Doak Linda M
Home Financials for this Owner
Home Financials are based on the most recent Mortgage that was taken out on this home.
Original Mortgage
$32,000
Interest Rate
8.42%
Mortgage Type
New Conventional
Purchase Details
Closed on
May 3, 1993
Sold by
Doak Arthur T and Or Linda
Bought by
Bangor Constance Anne and Bangor O
Create a Home Valuation Report for This Property
The Home Valuation Report is an in-depth analysis detailing your home's value as well as a comparison with similar homes in the area
Home Values in the Area
Average Home Value in this Area
Purchase History
| Date | Buyer | Sale Price | Title Company |
|---|---|---|---|
| Miller Ernest D | $65,000 | -- | |
| Doak Arthur T | $39,900 | -- | |
| Bangor Constance Anne | -- | -- |
Source: Public Records
Mortgage History
| Date | Status | Borrower | Loan Amount |
|---|---|---|---|
| Open | Miller Ernest D | $58,500 | |
| Closed | Doak Arthur T | $32,000 |
Source: Public Records
Tax History Compared to Growth
Tax History
| Year | Tax Paid | Tax Assessment Tax Assessment Total Assessment is a certain percentage of the fair market value that is determined by local assessors to be the total taxable value of land and additions on the property. | Land | Improvement |
|---|---|---|---|---|
| 2024 | $726 | $17,680 | $490 | $17,190 |
| 2023 | $726 | $17,680 | $490 | $17,190 |
| 2022 | $727 | $17,680 | $490 | $17,190 |
| 2021 | $649 | $14,490 | $420 | $14,070 |
| 2020 | $650 | $14,490 | $420 | $14,070 |
| 2019 | $650 | $14,490 | $420 | $14,070 |
| 2018 | $630 | $13,170 | $390 | $12,780 |
| 2017 | $663 | $13,170 | $390 | $12,780 |
| 2016 | $772 | $15,790 | $350 | $15,440 |
| 2015 | $772 | $15,790 | $350 | $15,440 |
| 2014 | $763 | $15,790 | $350 | $15,440 |
Source: Public Records
Map
Nearby Homes