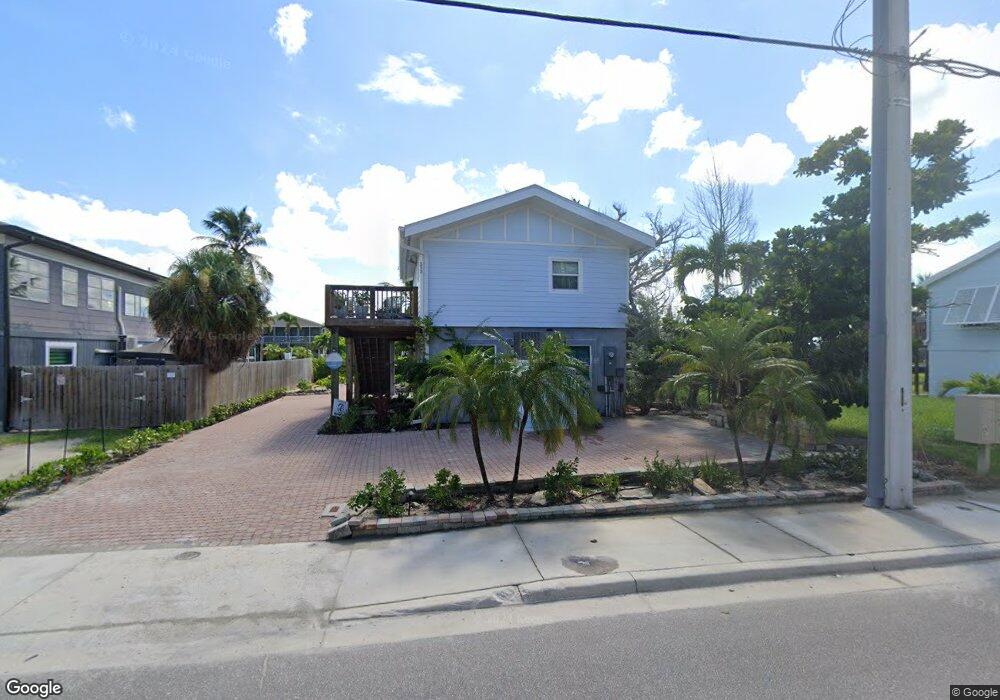
332 Crescent St Fort Myers Beach, FL 33931
Estimated Value: $736,000 - $1,133,000
2
Beds
1
Bath
480
Sq Ft
$1,944/Sq Ft
Est. Value
About This Home
This home is located at 332 Crescent St, Fort Myers Beach, FL 33931 and is currently estimated at $933,088, approximately $1,943 per square foot. 332 Crescent St is a home located in Lee County with nearby schools including Fort Myers Beach Elementary School, Cypress Lake Middle School, and Fort Myers Middle Academy.
Ownership History
Date
Name
Owned For
Owner Type
Purchase Details
Closed on
Oct 10, 2000
Sold by
Hammer Friedrich W
Bought by
Lighthouse Island Resort Inc
Current Estimated Value
Home Financials for this Owner
Home Financials are based on the most recent Mortgage that was taken out on this home.
Original Mortgage
$160,000
Interest Rate
7.97%
Purchase Details
Closed on
May 16, 1997
Sold by
Lee Cty Fl
Bought by
Hammer Friedrick W
Create a Home Valuation Report for This Property
The Home Valuation Report is an in-depth analysis detailing your home's value as well as a comparison with similar homes in the area
Home Values in the Area
Average Home Value in this Area
Purchase History
| Date | Buyer | Sale Price | Title Company |
|---|---|---|---|
| Lighthouse Island Resort Inc | $180,000 | -- | |
| Hammer Friedrick W | $4,000 | -- |
Source: Public Records
Mortgage History
| Date | Status | Borrower | Loan Amount |
|---|---|---|---|
| Open | Lighthouse Island Resort Inc | $1,150,000 | |
| Closed | Lighthouse Island Resort Inc | $1,000,000 | |
| Closed | Lighthouse Island Resort Inc | $160,000 |
Source: Public Records
Tax History Compared to Growth
Tax History
| Year | Tax Paid | Tax Assessment Tax Assessment Total Assessment is a certain percentage of the fair market value that is determined by local assessors to be the total taxable value of land and additions on the property. | Land | Improvement |
|---|---|---|---|---|
| 2025 | $8,716 | $536,733 | -- | -- |
| 2024 | $7,282 | $487,939 | -- | -- |
| 2023 | $7,282 | $443,581 | $0 | $0 |
| 2022 | $6,822 | $403,255 | $0 | $0 |
| 2021 | $5,642 | $388,694 | $374,898 | $13,796 |
| 2020 | $5,154 | $334,309 | $318,159 | $16,150 |
| 2019 | $4,947 | $344,540 | $318,159 | $26,381 |
| 2018 | $4,672 | $343,864 | $318,159 | $25,705 |
| 2017 | $4,291 | $302,977 | $264,132 | $38,845 |
| 2016 | $4,004 | $278,532 | $269,101 | $9,431 |
| 2015 | $4,274 | $327,793 | $287,061 | $40,732 |
| 2014 | $3,106 | $185,999 | $162,020 | $23,979 |
| 2013 | -- | $195,598 | $176,655 | $18,943 |
Source: Public Records
Map
Nearby Homes
- 340 Crescent St
- 1041 3rd St
- 250 Crescent St
- 219 Primo Dr
- 265 Primo Dr
- 450 Old San Carlos Blvd Unit 309
- 450 Old San Carlos Blvd Unit 303
- 122 Crescent St Unit 5
- 155 Palermo Cir
- 1207 Estero Blvd
- 1021 Estero Blvd
- 1021 Estero Blvd Unit 4
- 130 Palermo Cir
- 391 Palermo Cir
- 914 3rd St
- 1010 Estero Blvd
- 855 Lagoon St Unit 2
- 855 Lagoon St Unit 3
- 855 Lagoon St Unit 1
- 855 Lagoon St Unit 4