332 E 3rd St Moorestown, NJ 08057
Estimated Value: $502,285 - $692,000
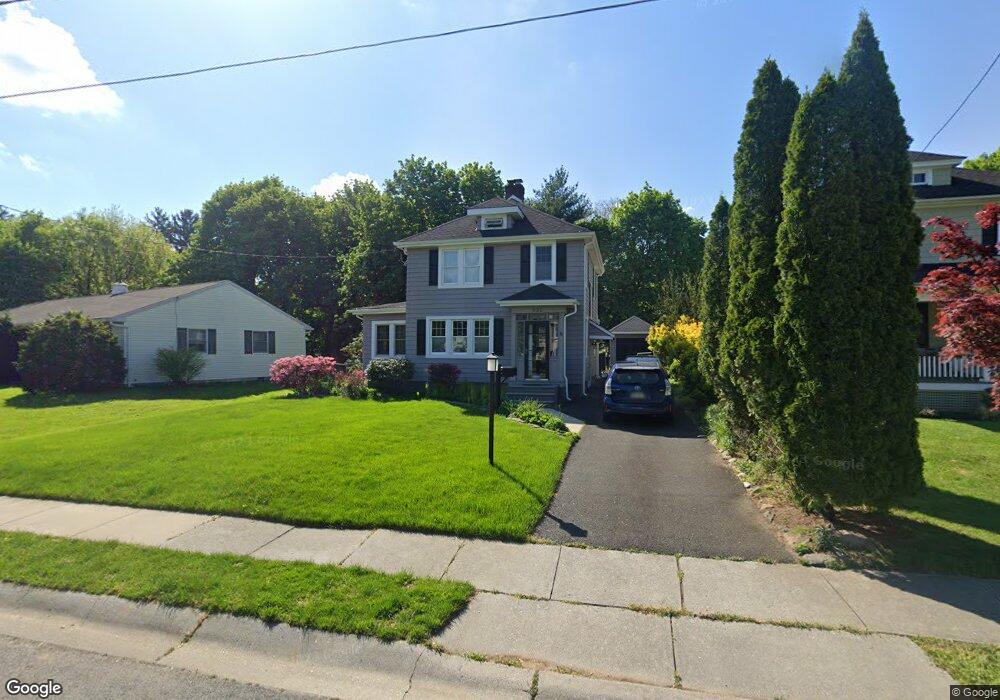
About This Home
This home is located at 332 E 3rd St, Moorestown, NJ 08057 and is currently estimated at $578,071, approximately $494 per square foot. 332 E 3rd St is a home located in Burlington County with nearby schools including South Valley Elementary School, Moorestown Upper Elementary School, and William Allen Middle School.
Ownership History
We collect this data history from publicly available records. To have your information removed, we recommend requesting removal directly through your county’s website.
Purchase Details
Purchase Details
Home Financials for this Owner
Home Financials are based on the most recent Mortgage that was taken out on this home.Purchase Details
Home Financials for this Owner
Home Financials are based on the most recent Mortgage that was taken out on this home.Home Values in the Area
Average Home Value in this Area
Purchase History
We collect this data history from publicly available records. To have your information removed, we recommend requesting removal directly through your county’s website.
| Date | Buyer | Sale Price | Title Company |
|---|---|---|---|
| -- | None Listed On Document | ||
| $385,500 | Surety Title Corp | ||
| $139,000 | Infinity Title Agency Inc |
Mortgage History
We collect this data history from publicly available records. To have your information removed, we recommend requesting removal directly through your county’s website.
| Date | Status | Borrower | Loan Amount |
|---|---|---|---|
| Previous Owner | $308,000 | ||
| Previous Owner | $130,000 |
Tax History
We collect this data history from publicly available records. To have your information removed, we recommend requesting removal directly through your county’s website.
| Year | Tax Paid | Tax Assessment Tax Assessment Total Assessment is a certain percentage of the fair market value that is determined by local assessors to be the total taxable value of land and additions on the property. | Land | Improvement |
|---|---|---|---|---|
| 2025 | $7,612 | $268,300 | $146,600 | $121,700 |
| 2024 | $7,381 | $268,300 | $146,600 | $121,700 |
| 2023 | $7,381 | $268,300 | $146,600 | $121,700 |
| 2022 | $7,306 | $268,300 | $146,600 | $121,700 |
| 2021 | $7,209 | $268,300 | $146,600 | $121,700 |
| 2020 | $7,164 | $268,300 | $146,600 | $121,700 |
| 2019 | $7,038 | $268,300 | $146,600 | $121,700 |
| 2018 | $6,847 | $268,300 | $146,600 | $121,700 |
| 2017 | $6,906 | $268,300 | $146,600 | $121,700 |
| 2016 | $6,882 | $268,300 | $146,600 | $121,700 |
| 2015 | $6,799 | $268,300 | $146,600 | $121,700 |
| 2014 | $6,455 | $268,300 | $146,600 | $121,700 |
Map
- 396 E 3rd St
- 429 E 2nd St
- 396 E Linden St
- 308 Elm St
- 440 Windrow Clusters Dr Unit 31
- 629 E Main St
- 205 E Central Ave
- 140 E Central Ave
- 633 E Main St Unit D4
- 633 E Main St Unit B2
- 210 E Oak Ave
- 465 Windrow Clusters Dr Unit 22
- 133 Plum St Unit 6
- 635 E Main St Unit 7
- 201 E Oak Ave
- 129 Plum St Unit C4
- 66 E 3rd St
- 0 Bridgeway Tract Unit NJBL2111242
- 500 Chester Ave
- 16 Windermere Dr
Ask me questions while you tour the home.