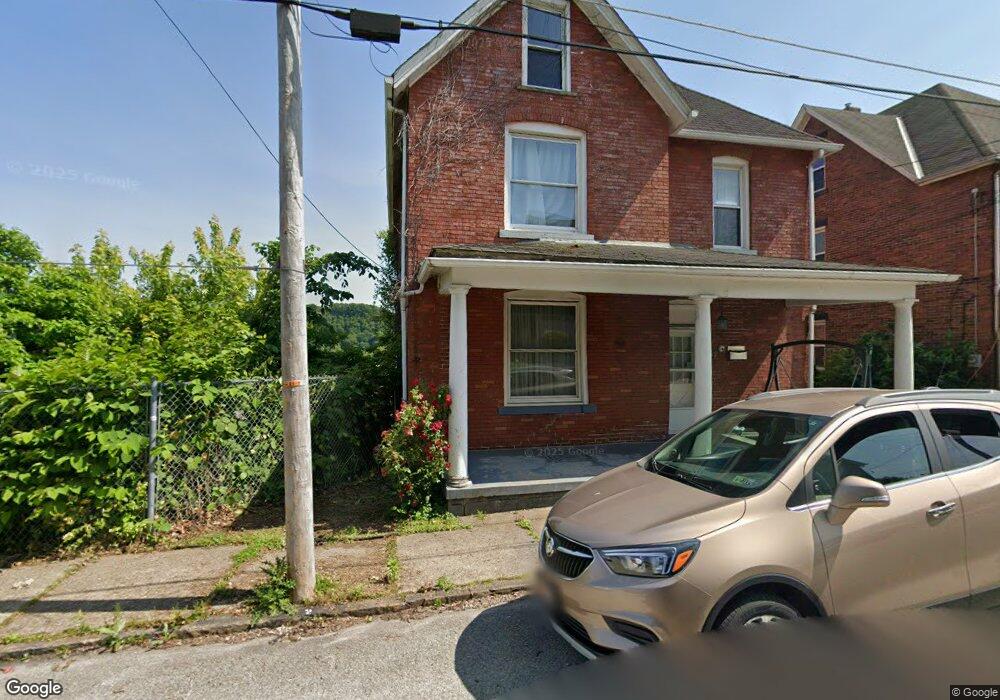
332 E 8th Ave Tarentum, PA 15084
Estimated Value: $84,000 - $98,000
4
Beds
3
Baths
2,006
Sq Ft
$45/Sq Ft
Est. Value
About This Home
This home is located at 332 E 8th Ave, Tarentum, PA 15084 and is currently estimated at $90,065, approximately $44 per square foot. 332 E 8th Ave is a home located in Allegheny County with nearby schools including Highlands Senior High School, Mary Queen of Apostles School, and St. Joseph High School.
Ownership History
Date
Name
Owned For
Owner Type
Purchase Details
Closed on
Dec 28, 2021
Sold by
Vincler Robert Paul
Bought by
Allenberg Chelsea
Current Estimated Value
Purchase Details
Closed on
Dec 16, 2021
Sold by
Vincler Robert Paul
Bought by
Allenberg Chelsea
Purchase Details
Closed on
Dec 22, 2009
Sold by
United States Of America By Se
Bought by
Vincler Robert Paul
Purchase Details
Closed on
Jan 5, 2009
Sold by
Grafton Carrie M
Bought by
U S Bank Na
Purchase Details
Closed on
Nov 12, 2003
Sold by
Lagrosse Mildred
Bought by
Shuttleworth Carrie
Home Financials for this Owner
Home Financials are based on the most recent Mortgage that was taken out on this home.
Original Mortgage
$41,000
Interest Rate
5.81%
Mortgage Type
FHA
Create a Home Valuation Report for This Property
The Home Valuation Report is an in-depth analysis detailing your home's value as well as a comparison with similar homes in the area
Home Values in the Area
Average Home Value in this Area
Purchase History
| Date | Buyer | Sale Price | Title Company |
|---|---|---|---|
| Allenberg Chelsea | $75,000 | -- | |
| Vincler Robert Paul | $7,500 | -- | |
| U S Bank Na | $1,768 | -- | |
| Shuttleworth Carrie | $41,000 | -- | |
| Allenberg Chelsea | $75,000 | -- |
Source: Public Records
Mortgage History
| Date | Status | Borrower | Loan Amount |
|---|---|---|---|
| Previous Owner | Shuttleworth Carrie | $41,000 |
Source: Public Records
Tax History
| Year | Tax Paid | Tax Assessment Tax Assessment Total Assessment is a certain percentage of the fair market value that is determined by local assessors to be the total taxable value of land and additions on the property. | Land | Improvement |
|---|---|---|---|---|
| 2025 | $565 | $16,000 | $14,200 | $1,800 |
| 2024 | $565 | $16,000 | $14,200 | $1,800 |
| 2023 | $565 | $16,000 | $14,200 | $1,800 |
| 2022 | $1,193 | $34,000 | $14,200 | $19,800 |
| 2021 | $161 | $34,000 | $14,200 | $19,800 |
| 2020 | $1,193 | $34,000 | $14,200 | $19,800 |
| 2019 | $1,185 | $34,000 | $14,200 | $19,800 |
| 2017 | $1,156 | $34,000 | $14,200 | $19,800 |
Source: Public Records
Map
Nearby Homes
Your Personal Tour Guide
Ask me questions while you tour the home.