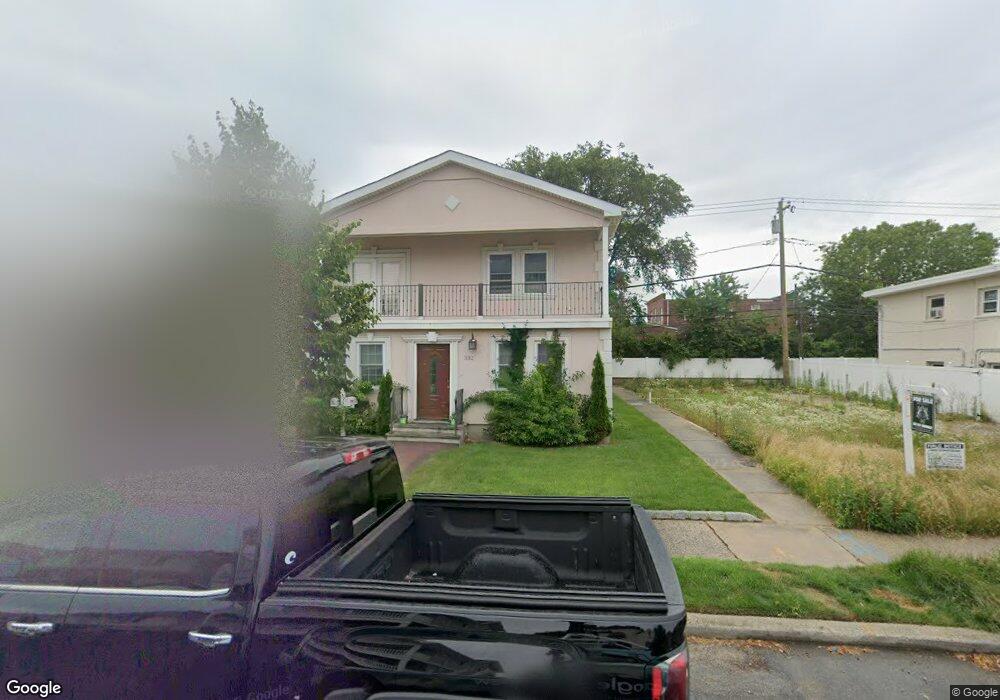
332 E Chester St Unit Main Long Beach, NY 11561
Estimated Value: $676,111 - $826,000
3
Beds
2
Baths
2,106
Sq Ft
$357/Sq Ft
Est. Value
About This Home
This home is located at 332 E Chester St Unit Main, Long Beach, NY 11561 and is currently estimated at $751,056, approximately $356 per square foot. 332 E Chester St Unit Main is a home located in Nassau County with nearby schools including Lido Elementary School, East Elementary School, and Lindell Elementary School.
Ownership History
Date
Name
Owned For
Owner Type
Purchase Details
Closed on
Dec 9, 2024
Sold by
Obadiah Albert and Obadiah Barry
Bought by
Barry Obadiah and Henry Obadiah Henry
Current Estimated Value
Purchase Details
Closed on
Nov 1, 2013
Sold by
Wallace Nancy T
Bought by
Obadiah Albert and Obadiah Barry
Purchase Details
Closed on
Dec 29, 2009
Sold by
Pipiani Ranjana C and Pipiani Roni
Bought by
Wallace Nancy T
Home Financials for this Owner
Home Financials are based on the most recent Mortgage that was taken out on this home.
Original Mortgage
$300,000
Interest Rate
4.71%
Mortgage Type
Purchase Money Mortgage
Purchase Details
Closed on
Jun 25, 1997
Sold by
Taspinar Aysegul
Bought by
Piplani Ranjana C
Create a Home Valuation Report for This Property
The Home Valuation Report is an in-depth analysis detailing your home's value as well as a comparison with similar homes in the area
Home Values in the Area
Average Home Value in this Area
Purchase History
| Date | Buyer | Sale Price | Title Company |
|---|---|---|---|
| Barry Obadiah | -- | Chicago Title Insurance Co | |
| Obadiah Barry | -- | Chicago Title Insurance Co | |
| Obadiah Barry | -- | Chicago Title Insurance Co | |
| Obadiah Albert | $225,000 | -- | |
| Obadiah Albert | $225,000 | -- | |
| Wallace Nancy T | $486,750 | -- | |
| Wallace Nancy T | $486,750 | -- | |
| Wallace Nancy T | $486,750 | -- | |
| Wallace Nancy T | $486,750 | -- | |
| Piplani Ranjana C | $172,000 | -- | |
| Piplani Ranjana C | $172,000 | -- |
Source: Public Records
Mortgage History
| Date | Status | Borrower | Loan Amount |
|---|---|---|---|
| Previous Owner | Wallace Nancy T | $300,000 |
Source: Public Records
Tax History
| Year | Tax Paid | Tax Assessment Tax Assessment Total Assessment is a certain percentage of the fair market value that is determined by local assessors to be the total taxable value of land and additions on the property. | Land | Improvement |
|---|---|---|---|---|
| 2025 | $5,616 | $390 | $198 | $192 |
| 2024 | $749 | $390 | $198 | $192 |
| 2023 | $6,168 | $390 | $198 | $192 |
| 2022 | $6,168 | $390 | $198 | $192 |
| 2021 | $11,420 | $374 | $190 | $184 |
| 2020 | $11,602 | $816 | $677 | $139 |
| 2019 | $7,659 | $874 | $562 | $312 |
| 2018 | $7,768 | $670 | $0 | $0 |
| 2017 | $4,458 | $670 | $579 | $91 |
| 2016 | $827 | $1,011 | $725 | $286 |
| 2015 | $1,241 | $1,011 | $725 | $286 |
| 2014 | $1,241 | $1,011 | $725 | $286 |
| 2013 | $1,186 | $1,011 | $725 | $286 |
Source: Public Records
Map
Nearby Homes
- 325 E Park Ave
- 345 E Park Ave
- 509 Lincoln Blvd
- 236 E Market St
- 329 E Hudson St
- 344 E Fulton St
- 220 E Chester St
- 213 E Market St
- 610 Monroe Blvd
- 345 E Beech St
- 460 E Market St
- 265 E Pine St
- 159 Monroe Blvd Unit Upper
- 157 Monroe Blvd
- 333 E Broadway Unit 4H
- 333 E Broadway Unit 4G
- 149 Monroe Blvd
- 255 E Broadway Unit 303
- 538 E Park Ave
- 370 E Broadway
- 332 E Chester St
- 332 E Chester St Unit Lower
- 332 E Chester St Unit Upper
- 332 E Chester St Unit Top
- 328 E Chester St
- 336 E Chester St
- 324 E Chester St
- 324 E Chester St Unit Upper
- 340 E Chester St
- 333 E Park Ave
- 320 E Chester St Unit Lower
- 320 E Chester St
- 339 E Park Ave
- 339 E Park Ave Unit Upper
- 325 E Park Ave Unit Upper
- 325 E Park Ave Unit Office
- 346 E Chester St
- 335 E Chester St
- 345 E Park Ave
- 329 E Chester St
Your Personal Tour Guide
Ask me questions while you tour the home.