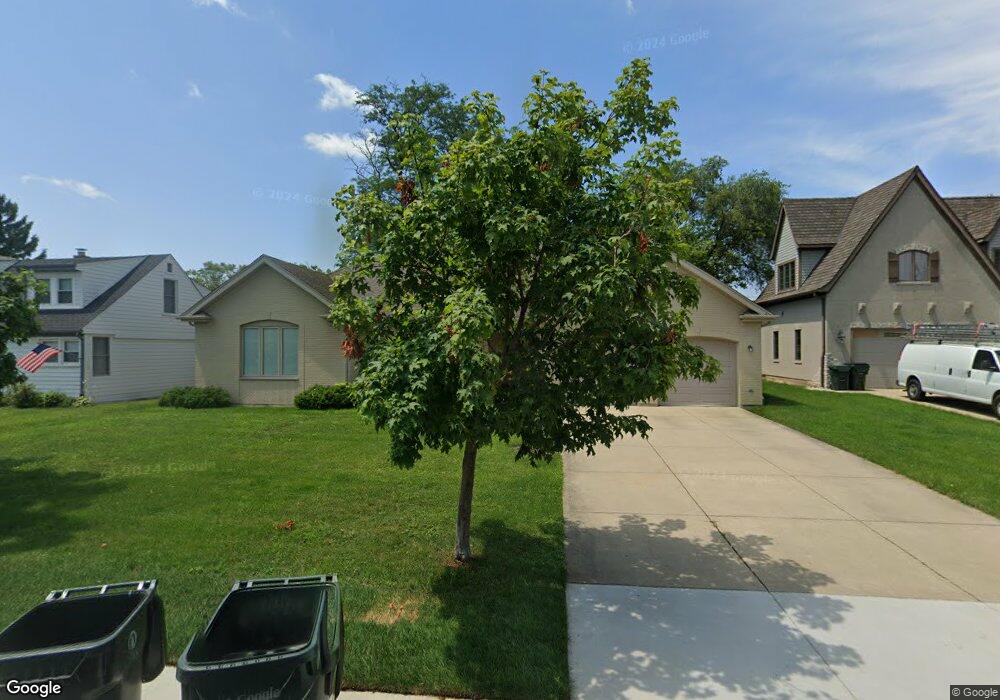
332 Elm St Glenview, IL 60025
Estimated Value: $1,037,000 - $1,143,000
4
Beds
2
Baths
3,499
Sq Ft
$310/Sq Ft
Est. Value
About This Home
This home is located at 332 Elm St, Glenview, IL 60025 and is currently estimated at $1,084,116, approximately $309 per square foot. 332 Elm St is a home located in Cook County with nearby schools including Hoffman Elementary School, Henking Elementary School, and Springman Middle School.
Ownership History
Date
Name
Owned For
Owner Type
Purchase Details
Closed on
Feb 20, 2024
Sold by
Nocher John D and Dilegge Diana M
Bought by
Wolf Alexander and Wolf Susan
Current Estimated Value
Home Financials for this Owner
Home Financials are based on the most recent Mortgage that was taken out on this home.
Original Mortgage
$766,550
Outstanding Balance
$750,405
Interest Rate
6.5%
Mortgage Type
New Conventional
Estimated Equity
$333,711
Purchase Details
Closed on
Mar 24, 1999
Sold by
Miller Cary M and Miller Kurt V
Bought by
Nocher John D and Dilegge Diana M
Home Financials for this Owner
Home Financials are based on the most recent Mortgage that was taken out on this home.
Original Mortgage
$177,300
Interest Rate
6.89%
Purchase Details
Closed on
Aug 13, 1997
Sold by
Miller June and Miller Derrick J
Bought by
Miller Cary M and Miller Jeff S
Purchase Details
Closed on
Apr 17, 1997
Sold by
Newman Frank and Klajda Olympia
Bought by
Miller June and Miller Cary M
Create a Home Valuation Report for This Property
The Home Valuation Report is an in-depth analysis detailing your home's value as well as a comparison with similar homes in the area
Home Values in the Area
Average Home Value in this Area
Purchase History
We collect this data history from publicly available records. To have your information removed, we recommend requesting removal directly through your county’s website.
| Date | Buyer | Sale Price | Title Company |
|---|---|---|---|
| Wolf Alexander | $960,000 | Proper Title | |
| Nocher John D | $197,000 | -- | |
| Miller Cary M | -- | -- | |
| Miller June | $139,000 | Attorneys Natl Title Network |
Source: Public Records
Mortgage History
We collect this data history from publicly available records. To have your information removed, we recommend requesting removal directly through your county’s website.
| Date | Status | Borrower | Loan Amount |
|---|---|---|---|
| Open | Wolf Alexander | $766,550 | |
| Previous Owner | Nocher John D | $177,300 |
Source: Public Records
Tax History
| Year | Tax Paid | Tax Assessment Tax Assessment Total Assessment is a certain percentage of the fair market value that is determined by local assessors to be the total taxable value of land and additions on the property. | Land | Improvement |
|---|---|---|---|---|
| 2025 | $13,293 | $89,000 | $13,615 | $75,385 |
| 2024 | $13,293 | $63,047 | $11,437 | $51,610 |
| 2023 | $12,900 | $63,047 | $11,437 | $51,610 |
| 2022 | $12,900 | $63,047 | $11,437 | $51,610 |
| 2021 | $10,270 | $44,296 | $9,802 | $34,494 |
| 2020 | $10,129 | $44,296 | $9,802 | $34,494 |
| 2019 | $10,997 | $56,071 | $9,802 | $46,269 |
| 2018 | $10,668 | $49,420 | $8,441 | $40,979 |
| 2017 | $10,451 | $49,420 | $8,441 | $40,979 |
| 2016 | $10,073 | $49,420 | $8,441 | $40,979 |
| 2015 | $8,791 | $39,016 | $7,079 | $31,937 |
| 2014 | $8,637 | $39,016 | $7,079 | $31,937 |
| 2013 | $8,361 | $39,016 | $7,079 | $31,937 |
Source: Public Records
Map
Nearby Homes
- 2142 Harrison St
- 440 Briarhill Rd
- 517 Briarhill Ln
- 2232 Covert Rd
- 128 Parkview Rd
- 124 Harlem Ave
- 1810 Culver Ln
- 1942 Palmgren Dr
- 2 Washington St
- 7314 Foster St
- 2506 Allison Ct
- 9516 Marion Ave
- 706 Waukegan Rd Unit C203
- 706 Waukegan Rd Unit 206-C
- 609 Carriage Hill Dr
- 203 Valerie Ct
- 9447 Overhill Ave
- 9523 Sayre Ave
- 9506 Ozanam Ave
- 7027 Foster St
Your Personal Tour Guide
Ask me questions while you tour the home.