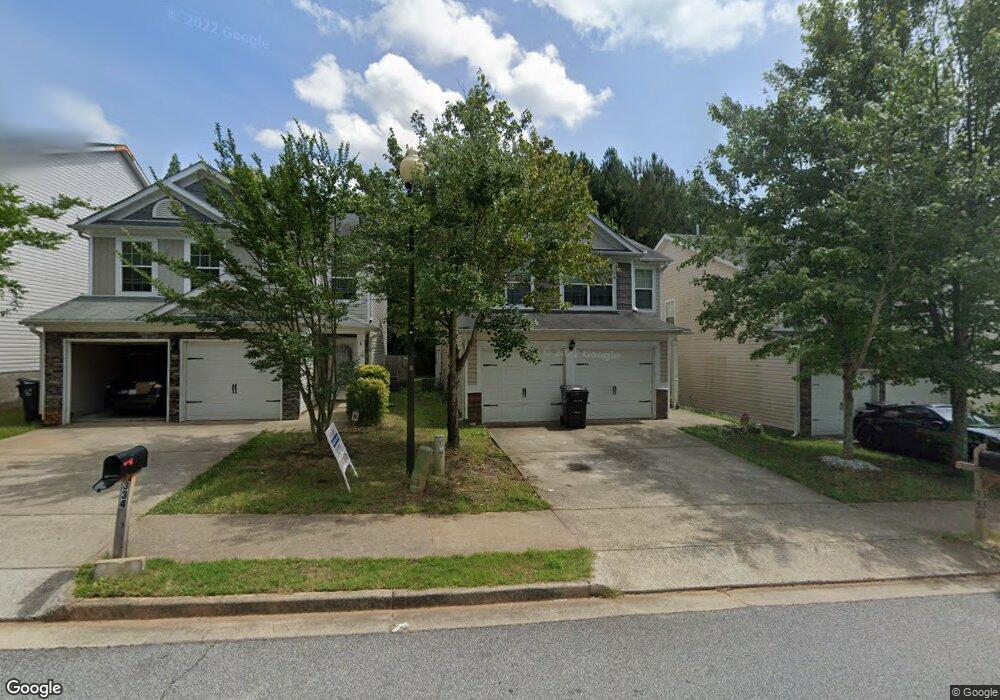
332 Hidden Creek Ln Canton, GA 30114
Estimated Value: $366,000 - $385,630
4
Beds
4
Baths
2,340
Sq Ft
$161/Sq Ft
Est. Value
About This Home
This home is located at 332 Hidden Creek Ln, Canton, GA 30114 and is currently estimated at $375,815, approximately $160 per square foot. 332 Hidden Creek Ln is a home located in Cherokee County with nearby schools including Liberty Elementary School, Freedom Middle School, and Cherokee High School.
Ownership History
Date
Name
Owned For
Owner Type
Purchase Details
Closed on
Sep 21, 2010
Sold by
Hud & Housing Of Urban Dev
Bought by
Robb Tina M
Current Estimated Value
Home Financials for this Owner
Home Financials are based on the most recent Mortgage that was taken out on this home.
Original Mortgage
$133,234
Outstanding Balance
$87,679
Interest Rate
4.45%
Mortgage Type
FHA
Estimated Equity
$288,136
Purchase Details
Closed on
Mar 2, 2010
Sold by
Central Mortgage Co
Bought by
Hud-Housing Of Urban Dev
Purchase Details
Closed on
Jul 24, 2008
Sold by
Legacy Communities Of Hidden C
Bought by
Morrison Freeman K and Morrison Anna I
Home Financials for this Owner
Home Financials are based on the most recent Mortgage that was taken out on this home.
Original Mortgage
$173,362
Interest Rate
6.43%
Create a Home Valuation Report for This Property
The Home Valuation Report is an in-depth analysis detailing your home's value as well as a comparison with similar homes in the area
Home Values in the Area
Average Home Value in this Area
Purchase History
| Date | Buyer | Sale Price | Title Company |
|---|---|---|---|
| Robb Tina M | $130,500 | -- | |
| Hud-Housing Of Urban Dev | -- | -- | |
| Central Mortgage Co | $142,000 | -- | |
| Morrison Freeman K | $176,200 | -- |
Source: Public Records
Mortgage History
| Date | Status | Borrower | Loan Amount |
|---|---|---|---|
| Open | Robb Tina M | $133,234 | |
| Previous Owner | Morrison Freeman K | $173,362 |
Source: Public Records
Tax History Compared to Growth
Tax History
| Year | Tax Paid | Tax Assessment Tax Assessment Total Assessment is a certain percentage of the fair market value that is determined by local assessors to be the total taxable value of land and additions on the property. | Land | Improvement |
|---|---|---|---|---|
| 2025 | $4,395 | $152,760 | $30,000 | $122,760 |
| 2024 | $3,901 | $136,280 | $28,000 | $108,280 |
| 2023 | $4,229 | $147,760 | $26,000 | $121,760 |
| 2022 | $3,365 | $117,240 | $21,600 | $95,640 |
| 2021 | $3,003 | $98,480 | $17,200 | $81,280 |
| 2020 | $2,813 | $92,160 | $16,000 | $76,160 |
| 2019 | $2,496 | $81,720 | $14,000 | $67,720 |
| 2018 | $2,453 | $79,840 | $14,000 | $65,840 |
| 2017 | $2,279 | $184,300 | $12,000 | $61,720 |
| 2016 | $1,845 | $179,200 | $12,000 | $59,680 |
| 2015 | $1,715 | $165,100 | $9,600 | $56,440 |
| 2014 | $1,934 | $150,100 | $9,600 | $50,440 |
Source: Public Records
Map
Nearby Homes
- 922 Gardenia Curve
- 220 Hidden Creek Point
- 808 Inkberry Rd
- 168 Spring Way Square
- 529 Poplar Bend
- 116 Spring Way Square
- 533 Poplar Bend
- 230 Valley Crossing
- 256 Valley Crossing
- 262 Valley Crossing
- 151 Nacoochee Way
- 288 Valley Crossing
- 137 Nacoochee Way
- 265 Valley Crossing
- 810 Ash St
- 132 Nacoochee Way
- 314 Valley Crossing
- 334 Hidden Creek Ln
- 330 Hidden Creek Ln
- 336 Hidden Creek Ln
- 328 Hidden Creek Ln
- 338 Hidden Creek Ln
- 406 Hidden Creek Ct
- 408 Hidden Creek Ct
- 404 Hidden Creek Ct
- 410 Hidden Creek Ct
- 324 Hidden Creek Ln
- 337 Hidden Creek Ln Unit Gaa000
- 337 Hidden Creek Ln
- 337 Hidden Creek Ln Unit GAA0007
- 339 Hidden Creek Ln
- 335 Hidden Creek Ln
- 402 Hidden Creek Ct
- 341 Hidden Creek Ln
- 342 Hidden Creek Ln
- 322 Hidden Creek Ln
- 333 Hidden Creek Ln