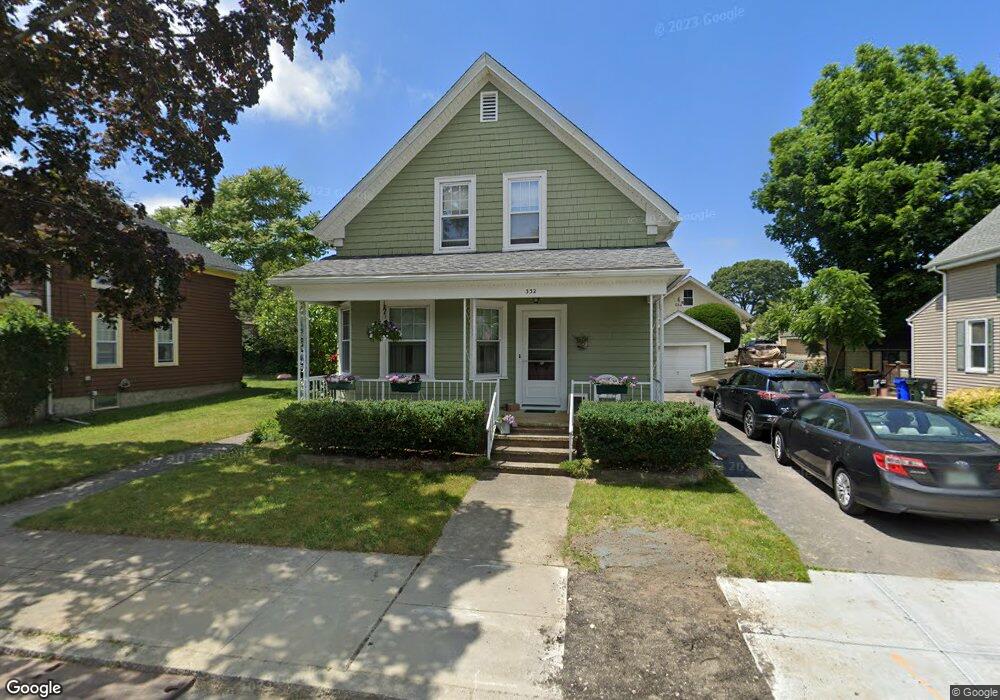
332 Kenyon St Fall River, MA 02720
Bank Street NeighborhoodEstimated Value: $394,000 - $430,000
3
Beds
2
Baths
1,416
Sq Ft
$292/Sq Ft
Est. Value
About This Home
This home is located at 332 Kenyon St, Fall River, MA 02720 and is currently estimated at $414,134, approximately $292 per square foot. 332 Kenyon St is a home located in Bristol County with nearby schools including Spencer Borden Elementary School, Morton Middle School, and B M C Durfee High School.
Ownership History
Date
Name
Owned For
Owner Type
Purchase Details
Closed on
Apr 21, 2011
Sold by
Boardman John E and Boardman Louisa S
Bought by
Boardman John W and Steen Susan E
Current Estimated Value
Purchase Details
Closed on
Oct 13, 1972
Bought by
Boardman John E and Boardman Louisa S
Create a Home Valuation Report for This Property
The Home Valuation Report is an in-depth analysis detailing your home's value as well as a comparison with similar homes in the area
Home Values in the Area
Average Home Value in this Area
Purchase History
| Date | Buyer | Sale Price | Title Company |
|---|---|---|---|
| Boardman John W | -- | -- | |
| Boardman John E | $222,900 | -- |
Source: Public Records
Mortgage History
| Date | Status | Borrower | Loan Amount |
|---|---|---|---|
| Previous Owner | Boardman John E | $26,000 | |
| Previous Owner | Boardman John E | $38,615 | |
| Previous Owner | Boardman John E | $27,438 | |
| Previous Owner | Boardman John E | $50,000 |
Source: Public Records
Tax History
| Year | Tax Paid | Tax Assessment Tax Assessment Total Assessment is a certain percentage of the fair market value that is determined by local assessors to be the total taxable value of land and additions on the property. | Land | Improvement |
|---|---|---|---|---|
| 2025 | $3,884 | $339,200 | $131,700 | $207,500 |
| 2024 | $3,668 | $319,200 | $126,700 | $192,500 |
| 2023 | $3,474 | $283,100 | $113,700 | $169,400 |
| 2022 | $3,231 | $256,000 | $105,300 | $150,700 |
| 2021 | $3,191 | $230,700 | $99,400 | $131,300 |
| 2020 | $3,201 | $221,500 | $95,700 | $125,800 |
| 2019 | $3,132 | $214,800 | $95,700 | $119,100 |
| 2018 | $2,975 | $203,500 | $95,700 | $107,800 |
| 2017 | $2,836 | $202,600 | $95,700 | $106,900 |
| 2016 | $2,688 | $197,200 | $95,700 | $101,500 |
| 2015 | $2,498 | $191,000 | $89,500 | $101,500 |
| 2014 | $2,403 | $191,000 | $89,500 | $101,500 |
Source: Public Records
Map
Nearby Homes
Your Personal Tour Guide
Ask me questions while you tour the home.