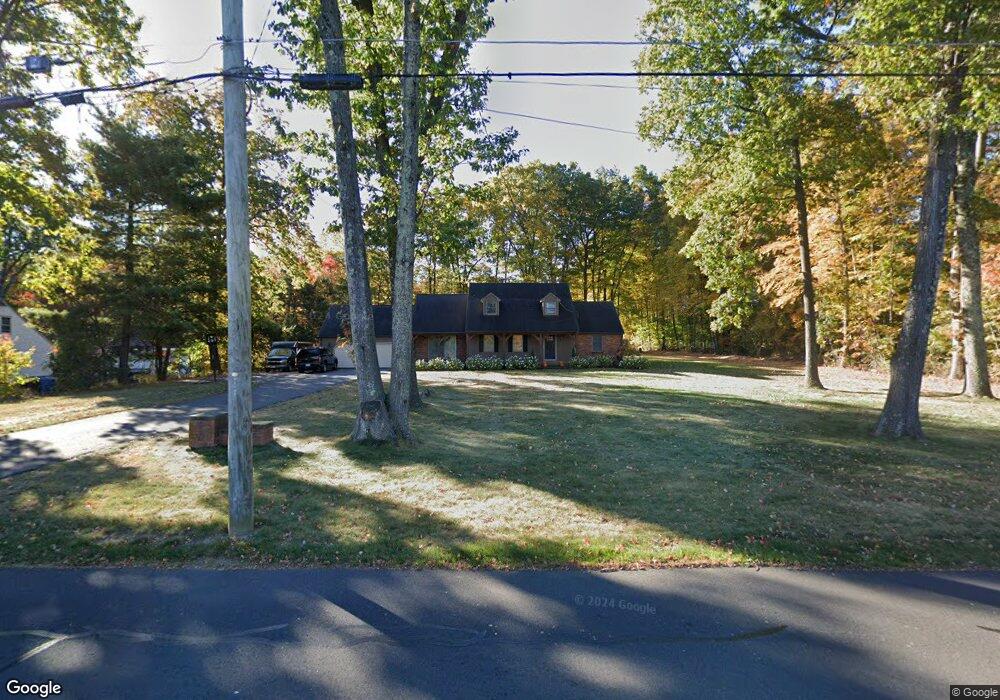
332 Lazy Ln Southington, CT 06489
West Southington NeighborhoodEstimated Value: $557,000 - $702,000
4
Beds
3
Baths
3,344
Sq Ft
$188/Sq Ft
Est. Value
About This Home
This home is located at 332 Lazy Ln, Southington, CT 06489 and is currently estimated at $628,841, approximately $188 per square foot. 332 Lazy Ln is a home located in Hartford County with nearby schools including Reuben E. Thalberg Elementary School, Joseph A. Depaolo Middle School, and Southington High School.
Ownership History
Date
Name
Owned For
Owner Type
Purchase Details
Closed on
Dec 20, 2007
Sold by
Residential Fndg Llc
Bought by
Ciccarillo Keith
Current Estimated Value
Purchase Details
Closed on
Mar 12, 2003
Sold by
Cendant Mobility Fin C
Bought by
Collins Luc J and Collins Diane M
Purchase Details
Closed on
Aug 21, 2000
Sold by
Landino Ralph and Landino Barbara J
Bought by
Mitchell James R and Mitchell Monica
Create a Home Valuation Report for This Property
The Home Valuation Report is an in-depth analysis detailing your home's value as well as a comparison with similar homes in the area
Home Values in the Area
Average Home Value in this Area
Purchase History
| Date | Buyer | Sale Price | Title Company |
|---|---|---|---|
| Ciccarillo Keith | $268,000 | -- | |
| Collins Luc J | $285,000 | -- | |
| Cendant Mobility Fin C | $285,000 | -- | |
| Mitchell James R | $232,000 | -- |
Source: Public Records
Mortgage History
| Date | Status | Borrower | Loan Amount |
|---|---|---|---|
| Open | Mitchell James R | $75,000 | |
| Open | Mitchell James R | $217,000 |
Source: Public Records
Tax History
| Year | Tax Paid | Tax Assessment Tax Assessment Total Assessment is a certain percentage of the fair market value that is determined by local assessors to be the total taxable value of land and additions on the property. | Land | Improvement |
|---|---|---|---|---|
| 2025 | $9,145 | $275,360 | $64,260 | $211,100 |
| 2024 | $8,657 | $275,360 | $64,260 | $211,100 |
| 2023 | $8,360 | $275,360 | $64,260 | $211,100 |
| 2022 | $8,021 | $275,360 | $64,260 | $211,100 |
| 2021 | $7,994 | $275,360 | $64,260 | $211,100 |
| 2020 | $7,962 | $259,950 | $65,580 | $194,370 |
| 2019 | $7,965 | $259,950 | $65,580 | $194,370 |
| 2018 | $7,689 | $252,270 | $65,580 | $186,690 |
| 2017 | $7,689 | $252,270 | $65,580 | $186,690 |
| 2016 | $7,477 | $252,270 | $65,580 | $186,690 |
| 2015 | $6,954 | $238,640 | $62,450 | $176,190 |
| 2014 | $6,768 | $238,640 | $62,450 | $176,190 |
Source: Public Records
Map
Nearby Homes
- 457 Curtiss St
- 244 Curtiss St
- 45 Hart St Unit A
- 554 Spring St
- 76 Kane St
- 1384 West St
- 285 Queen St Unit 10I
- 81 Laning St
- 0 Winchester Estates Lot 17
- 500 Darling St Unit 12J
- 62 Bagno Dr
- 10 Meadow Rd
- 4 Maple Rd
- 39 Riverside Dr
- 288 Laning St
- 55 Columbus Blvd Unit 14
- 71 Lowery Dr
- 67 Dogwood Dr
- 53 Alder Ln
- 951 Sweetheart Path Unit 951