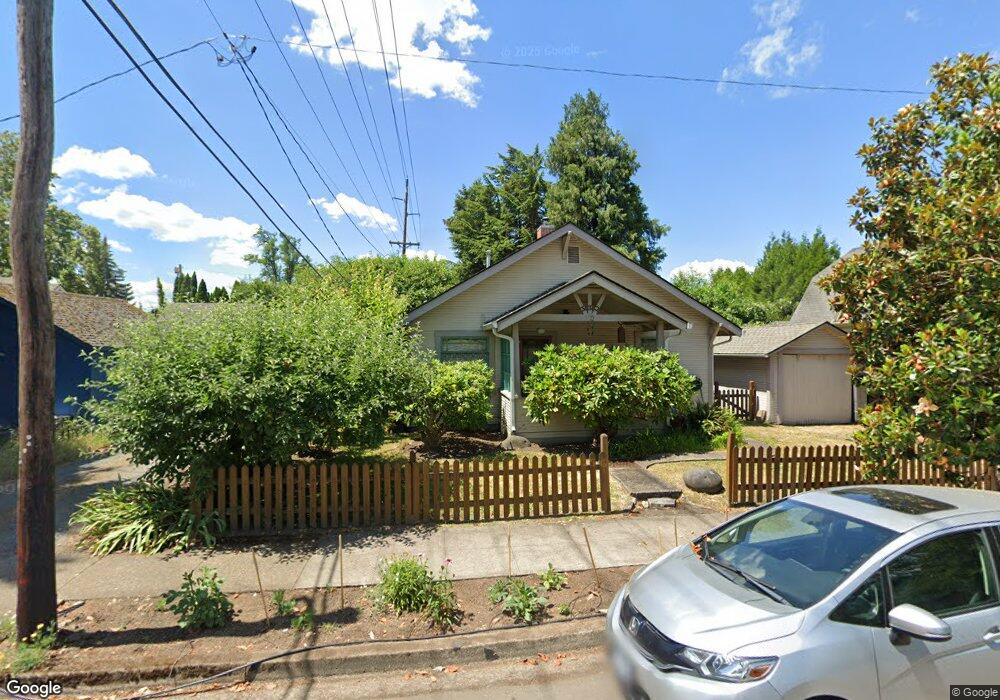
332 N 7th St Springfield, OR 97477
Washburne District NeighborhoodEstimated Value: $416,709 - $517,000
4
Beds
2
Baths
1,764
Sq Ft
$261/Sq Ft
Est. Value
About This Home
This home is located at 332 N 7th St, Springfield, OR 97477 and is currently estimated at $461,177, approximately $261 per square foot. 332 N 7th St is a home located in Lane County with nearby schools including Two Rivers Dos Rios Elementary School, Hamlin Middle School, and Springfield High School.
Ownership History
Date
Name
Owned For
Owner Type
Purchase Details
Closed on
May 30, 2023
Sold by
Hayes Ava Lynn Seese
Bought by
Ava Seese Hayes Living Trust and Hayes
Current Estimated Value
Purchase Details
Closed on
Jun 7, 2006
Sold by
Hayes Ava Lynn Seese and Hayes Jeri Seese
Bought by
Hayes Ava Lynn Seese
Purchase Details
Closed on
Aug 16, 2002
Sold by
Feighan Mary Clare
Bought by
Hayes Jeri S
Create a Home Valuation Report for This Property
The Home Valuation Report is an in-depth analysis detailing your home's value as well as a comparison with similar homes in the area
Home Values in the Area
Average Home Value in this Area
Purchase History
We collect this data history from publicly available records. To have your information removed, we recommend requesting removal directly through your county’s website.
| Date | Buyer | Sale Price | Title Company |
|---|---|---|---|
| Ava Seese Hayes Living Trust | -- | None Listed On Document | |
| Hayes Ava Lynn Seese | -- | Evergreen Land Title Co | |
| Hayes Jeri S | $159,000 | Western Title & Escrow Compa |
Source: Public Records
Tax History
| Year | Tax Paid | Tax Assessment Tax Assessment Total Assessment is a certain percentage of the fair market value that is determined by local assessors to be the total taxable value of land and additions on the property. | Land | Improvement |
|---|---|---|---|---|
| 2025 | $2,772 | $151,174 | -- | -- |
| 2024 | $2,727 | $146,771 | -- | -- |
| 2023 | $2,727 | $142,497 | $0 | $0 |
| 2022 | $2,526 | $138,347 | $0 | $0 |
| 2021 | $2,481 | $134,318 | $0 | $0 |
| 2020 | $2,408 | $130,406 | $0 | $0 |
| 2019 | $2,336 | $126,608 | $0 | $0 |
| 2018 | $2,202 | $119,341 | $0 | $0 |
| 2017 | $2,117 | $119,341 | $0 | $0 |
| 2016 | $2,073 | $115,865 | $0 | $0 |
| 2015 | $2,014 | $112,490 | $0 | $0 |
| 2014 | $1,983 | $109,214 | $0 | $0 |
Source: Public Records
Map
Nearby Homes
Your Personal Tour Guide
Ask me questions while you tour the home.