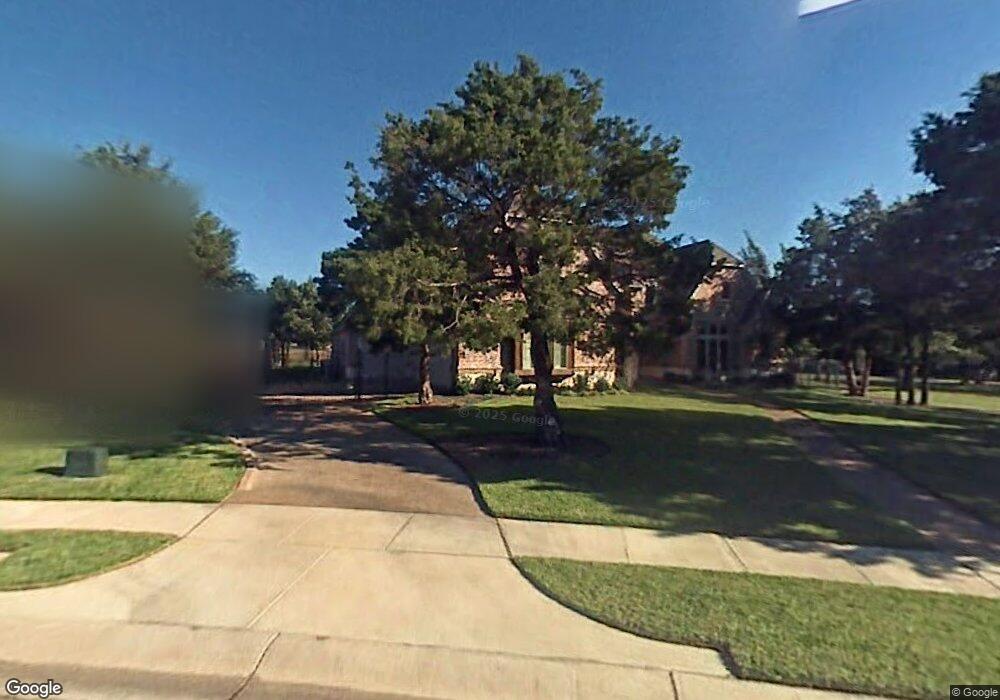
332 Oak Pointe Ln Southlake, TX 76092
Estimated Value: $2,033,000 - $2,161,000
5
Beds
5
Baths
5,499
Sq Ft
$384/Sq Ft
Est. Value
About This Home
This home is located at 332 Oak Pointe Ln, Southlake, TX 76092 and is currently estimated at $2,113,218, approximately $384 per square foot. 332 Oak Pointe Ln is a home located in Tarrant County with nearby schools including Walnut Grove Elementary School, Don T. Durham Intermediate School, and Carroll Middle School.
Ownership History
Date
Name
Owned For
Owner Type
Purchase Details
Closed on
May 24, 2005
Sold by
Tuscany American Homes Inc
Bought by
Swank Gregory A and Swank Julane J
Current Estimated Value
Home Financials for this Owner
Home Financials are based on the most recent Mortgage that was taken out on this home.
Original Mortgage
$608,500
Outstanding Balance
$317,072
Interest Rate
5.83%
Mortgage Type
Unknown
Estimated Equity
$1,796,146
Purchase Details
Closed on
Feb 8, 2005
Sold by
H Creek Development Llc
Bought by
Tuscany American Homes Inc
Home Financials for this Owner
Home Financials are based on the most recent Mortgage that was taken out on this home.
Original Mortgage
$612,000
Interest Rate
5.77%
Mortgage Type
Construction
Create a Home Valuation Report for This Property
The Home Valuation Report is an in-depth analysis detailing your home's value as well as a comparison with similar homes in the area
Home Values in the Area
Average Home Value in this Area
Purchase History
| Date | Buyer | Sale Price | Title Company |
|---|---|---|---|
| Swank Gregory A | $150,000 | Capital Title | |
| Tuscany American Homes Inc | -- | -- |
Source: Public Records
Mortgage History
| Date | Status | Borrower | Loan Amount |
|---|---|---|---|
| Open | Swank Gregory A | $608,500 | |
| Previous Owner | Tuscany American Homes Inc | $612,000 |
Source: Public Records
Tax History Compared to Growth
Tax History
| Year | Tax Paid | Tax Assessment Tax Assessment Total Assessment is a certain percentage of the fair market value that is determined by local assessors to be the total taxable value of land and additions on the property. | Land | Improvement |
|---|---|---|---|---|
| 2025 | $13,801 | $1,793,820 | $408,840 | $1,384,980 |
| 2024 | $13,801 | $1,793,820 | $408,840 | $1,384,980 |
| 2023 | $22,528 | $1,800,041 | $408,840 | $1,391,201 |
| 2022 | $24,241 | $1,310,357 | $278,200 | $1,032,157 |
| 2021 | $23,290 | $1,021,492 | $278,200 | $743,292 |
| 2020 | $23,500 | $1,022,345 | $275,760 | $746,585 |
| 2019 | $24,836 | $1,025,638 | $275,760 | $749,878 |
| 2018 | $18,667 | $972,826 | $275,760 | $697,066 |
| 2017 | $24,016 | $968,910 | $153,200 | $815,710 |
| 2016 | $24,125 | $973,335 | $153,200 | $820,135 |
| 2015 | $18,909 | $901,100 | $125,000 | $776,100 |
| 2014 | $18,909 | $901,100 | $125,000 | $776,100 |
Source: Public Records
Map
Nearby Homes
- 136 Sweet St
- 1018 Quail Run Rd
- 3179 Southlake Park Rd
- 415 Marshall Rd
- 3240 Woodland Dr
- 1006 Quail Run Rd
- 3333 Southlake Park Rd
- 2920 Burney Ln
- 5 W Dove Rd
- 2803 Tyler St
- 517 Round Hollow Ln
- 2112 Beaver Creek Ln
- 200 Murphy Dr
- 112 Murphy Dr
- 424 Saint Tropez Dr
- 212 Saint Tropez Dr
- 1013 Winfield Ct
- 1099 Burney Ln
- 2009 Wheeler Dr
- 1340 Burney Ln
- 324 Oak Pointe Ln
- 325 Oak Pointe Ln
- 316 Oak Pointe Ln
- 333 Oak Pointe Ln
- 2815 Ridgecrest Dr
- 2809 Ridgecrest Dr
- 317 Oak Pointe Ln
- 2915 Ridgecrest Dr
- 308 Oak Pointe Ln
- 309 Oak Pointe Ln
- 2725 Summit Ridge Dr
- 2787 Ridgecrest Dr
- 3005 Loch Meadow Ct
- 2732 Summit Ridge Dr
- 2709 Summit Ridge Dr
- 404 Keen Ct
- 3009 Loch Meadow Ct
- 3009 Loch Meadow Ct
- 3020 Loch Meadow Ct
- 3007 Ridgecrest Dr