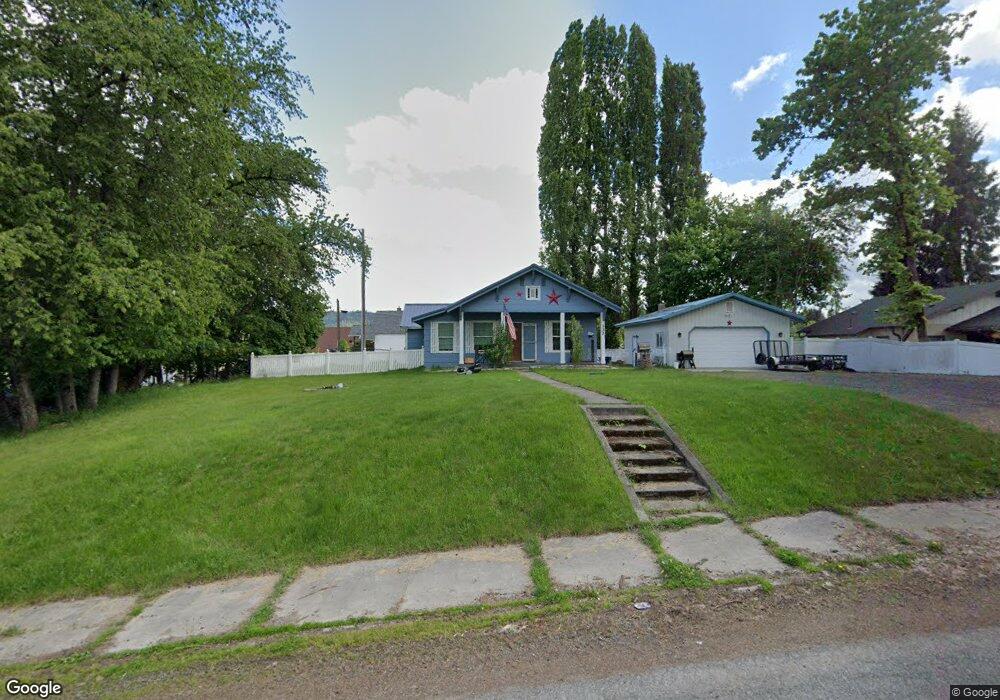
332 S 11th St Saint Maries, ID 83861
Estimated Value: $267,000 - $311,000
2
Beds
1
Bath
1,164
Sq Ft
$246/Sq Ft
Est. Value
About This Home
This home is located at 332 S 11th St, Saint Maries, ID 83861 and is currently estimated at $285,968, approximately $245 per square foot. 332 S 11th St is a home located in Benewah County with nearby schools including Heyburn Elementary School, UpRiver Elementary/Junior High School, and St. Maries Middle School.
Ownership History
Date
Name
Owned For
Owner Type
Purchase Details
Closed on
May 25, 2022
Sold by
Michael Thomas Logan
Bought by
Charles Ryan Patrick
Current Estimated Value
Home Financials for this Owner
Home Financials are based on the most recent Mortgage that was taken out on this home.
Original Mortgage
$200,000
Outstanding Balance
$189,996
Interest Rate
5.25%
Mortgage Type
New Conventional
Estimated Equity
$95,972
Purchase Details
Closed on
Jul 30, 2014
Sold by
Hamersma John and Hamersma Kay
Bought by
Thomas Logan Michael
Home Financials for this Owner
Home Financials are based on the most recent Mortgage that was taken out on this home.
Original Mortgage
$112,244
Interest Rate
4.12%
Mortgage Type
New Conventional
Purchase Details
Closed on
Aug 8, 2008
Sold by
Griffin Richard Lee and Griffin Carol J
Bought by
Hamersma John A
Home Financials for this Owner
Home Financials are based on the most recent Mortgage that was taken out on this home.
Original Mortgage
$125,000
Interest Rate
6.37%
Mortgage Type
Unknown
Create a Home Valuation Report for This Property
The Home Valuation Report is an in-depth analysis detailing your home's value as well as a comparison with similar homes in the area
Home Values in the Area
Average Home Value in this Area
Purchase History
| Date | Buyer | Sale Price | Title Company |
|---|---|---|---|
| Charles Ryan Patrick | -- | First American Title | |
| Thomas Logan Michael | -- | First American Title | |
| Hamersma John A | -- | -- |
Source: Public Records
Mortgage History
| Date | Status | Borrower | Loan Amount |
|---|---|---|---|
| Open | Charles Ryan Patrick | $200,000 | |
| Previous Owner | Thomas Logan Michael | $112,244 | |
| Previous Owner | Hamersma John A | $125,000 |
Source: Public Records
Tax History Compared to Growth
Tax History
| Year | Tax Paid | Tax Assessment Tax Assessment Total Assessment is a certain percentage of the fair market value that is determined by local assessors to be the total taxable value of land and additions on the property. | Land | Improvement |
|---|---|---|---|---|
| 2025 | $996 | $215,229 | $60,750 | $154,479 |
| 2024 | $996 | $212,312 | $60,750 | $151,562 |
| 2023 | $1,154 | $239,360 | $72,188 | $167,172 |
| 2022 | $1,400 | $259,486 | $85,500 | $173,986 |
| 2021 | $2,181 | $144,580 | $55,628 | $88,952 |
| 2020 | $2,092 | $126,296 | $47,052 | $79,244 |
| 2019 | $2,062 | $124,468 | $45,265 | $79,203 |
| 2018 | $1,052 | $120,249 | $45,265 | $74,984 |
| 2017 | $995 | $101,445 | $35,265 | $66,180 |
| 2016 | $1,079 | $108,101 | $35,252 | $72,849 |
| 2015 | $1,065 | $108,101 | $35,252 | $72,849 |
| 2014 | -- | $107,800 | $35,252 | $72,548 |
| 2013 | -- | $108,820 | $35,252 | $73,568 |
Source: Public Records
Map
Nearby Homes
- 1001 W Jefferson Ave
- Nka Railroad Grade Rd
- 2353 St Marie Sriver Rd
- 32 Horn Hooked Ln
- 31 Horn Hooked Ln
- 30 Horn Hooked Ln
- 22 Horn Hooked Ln
- 29 Horn Hooked Ln
- 28 Horn Hooked Ln
- 21 Horn Hooked Ln
- 20 Horn Hooked Ln
- 214 S 13th St
- 0 Ninth St
- 1161 Juniper Dr
- 1002 Highland Ave
- 915 Main Ave
- 1402 W Jefferson Ave
- 820 Plum Ln
- 235 S 5th St
- 1615 Lincoln Ave
- 346 S 11th St
- 326 S 11th St
- 1019 W Jefferson Ave
- 311 S 11th St
- 1103 W Jefferson Ave
- 327 S 11th St
- 1027 W Jefferson Ave
- 323 S 10th St
- 245 S 11th St
- 1121 W Jefferson Ave
- 341 S 11th St
- 1127 W Jefferson Ave
- 243 S 11th St
- 338 S 12th St
- 322 S 12th St
- 1000 Washington Ave
- 324 S 10th St
- 336 S 10th St
- 1120 W Jefferson Ave
- 223 S 11th St