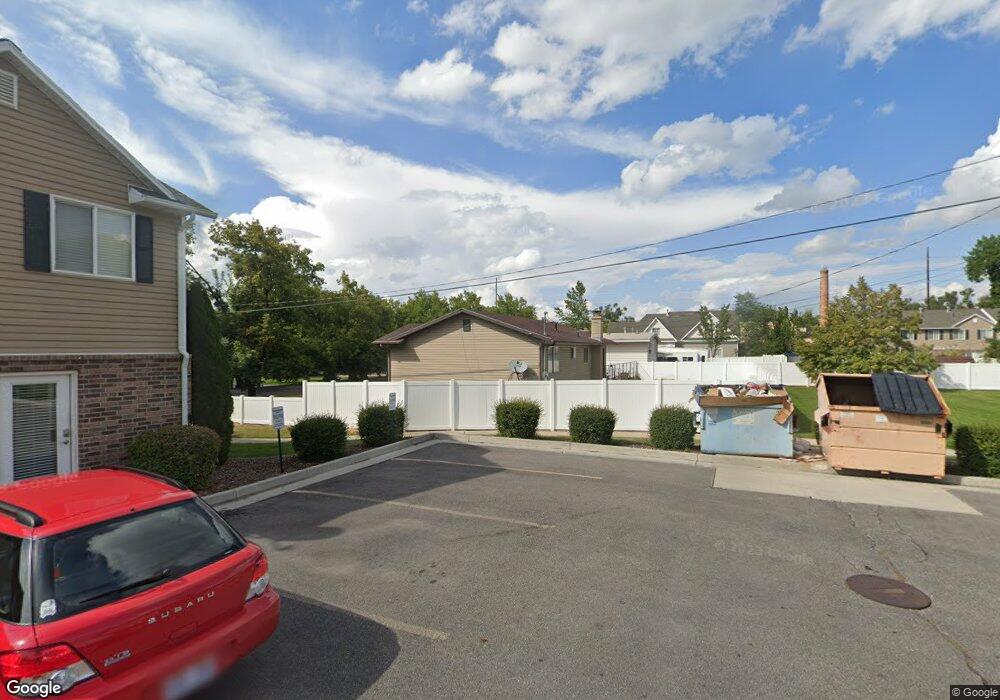
332 S 400 W Logan, UT 84321
Woodruff NeighborhoodEstimated Value: $341,000 - $372,028
4
Beds
2
Baths
1,854
Sq Ft
$195/Sq Ft
Est. Value
About This Home
This home is located at 332 S 400 W, Logan, UT 84321 and is currently estimated at $360,757, approximately $194 per square foot. 332 S 400 W is a home located in Cache County with nearby schools including Woodruff School, Mount Logan Middle School, and Logan High School.
Ownership History
Date
Name
Owned For
Owner Type
Purchase Details
Closed on
Nov 19, 2009
Sold by
Jef Investments Llc
Bought by
Dubal Harsh Y
Current Estimated Value
Home Financials for this Owner
Home Financials are based on the most recent Mortgage that was taken out on this home.
Original Mortgage
$125,600
Outstanding Balance
$76,279
Interest Rate
3.75%
Mortgage Type
Adjustable Rate Mortgage/ARM
Estimated Equity
$284,478
Purchase Details
Closed on
Nov 13, 2006
Sold by
Hoggan Jefrey A
Bought by
Jef Investments Llc
Home Financials for this Owner
Home Financials are based on the most recent Mortgage that was taken out on this home.
Original Mortgage
$131,000
Interest Rate
6.28%
Mortgage Type
New Conventional
Create a Home Valuation Report for This Property
The Home Valuation Report is an in-depth analysis detailing your home's value as well as a comparison with similar homes in the area
Home Values in the Area
Average Home Value in this Area
Purchase History
| Date | Buyer | Sale Price | Title Company |
|---|---|---|---|
| Dubal Harsh Y | -- | Hickman Land Title Company | |
| Jef Investments Llc | -- | Cache Title Company | |
| Hoggan Jefrey A | -- | Cache Title Company |
Source: Public Records
Mortgage History
| Date | Status | Borrower | Loan Amount |
|---|---|---|---|
| Open | Dubal Harsh Y | $125,600 | |
| Previous Owner | Hoggan Jefrey A | $131,000 |
Source: Public Records
Tax History Compared to Growth
Tax History
| Year | Tax Paid | Tax Assessment Tax Assessment Total Assessment is a certain percentage of the fair market value that is determined by local assessors to be the total taxable value of land and additions on the property. | Land | Improvement |
|---|---|---|---|---|
| 2025 | $1,752 | $226,540 | $0 | $0 |
| 2024 | $1,798 | $225,220 | $0 | $0 |
| 2023 | $1,886 | $225,150 | $0 | $0 |
| 2022 | $1,773 | $197,650 | $0 | $0 |
| 2021 | $1,685 | $290,280 | $60,000 | $230,280 |
| 2020 | $1,496 | $231,900 | $40,000 | $191,900 |
| 2019 | $1,368 | $202,953 | $40,000 | $162,953 |
| 2018 | $1,315 | $178,096 | $40,000 | $138,096 |
| 2017 | $1,178 | $84,315 | $0 | $0 |
| 2016 | $1,221 | $77,605 | $0 | $0 |
| 2015 | $1,125 | $77,605 | $0 | $0 |
| 2014 | $1,022 | $78,000 | $0 | $0 |
| 2013 | -- | $78,000 | $0 | $0 |
Source: Public Records
Map
Nearby Homes
- 352 S 400 W
- 354 S 400 W
- 322 S 400 W
- 346 S 385 W Unit 22
- 342 S 385 W Unit 24
- 358 S 400 W
- 344 S 385 W Unit 23
- 358 S 385 W Unit 28
- 352 S 385 W Unit 25
- 354 S 385 W Unit 26
- 356 S 385 W Unit 27
- 341 S 400 W
- 348 S 385 W Unit 21
- 325 S 400 W
- 355 400 W
- 343 S 370 W
- 343 S 370 W Unit 17
- 370 S 400 W
- 345 S 370 W Unit 18
- 347 S 370 W Unit 19