NOT LISTED FOR SALE

332 SE Mercury Ln Prineville, OR 97754

Estimated Value: $394,713 - $406,000

3 Beds
2 Baths
1,295 Sq Ft
$309/Sq Ft Est. Value

Last Sold December 17, 2012

Last sale price $117,000 $90 Per Sq Ft

Est. 242% increase in value since last sale

Current estimated payment $2,340/month

About This Home

As of December 2012

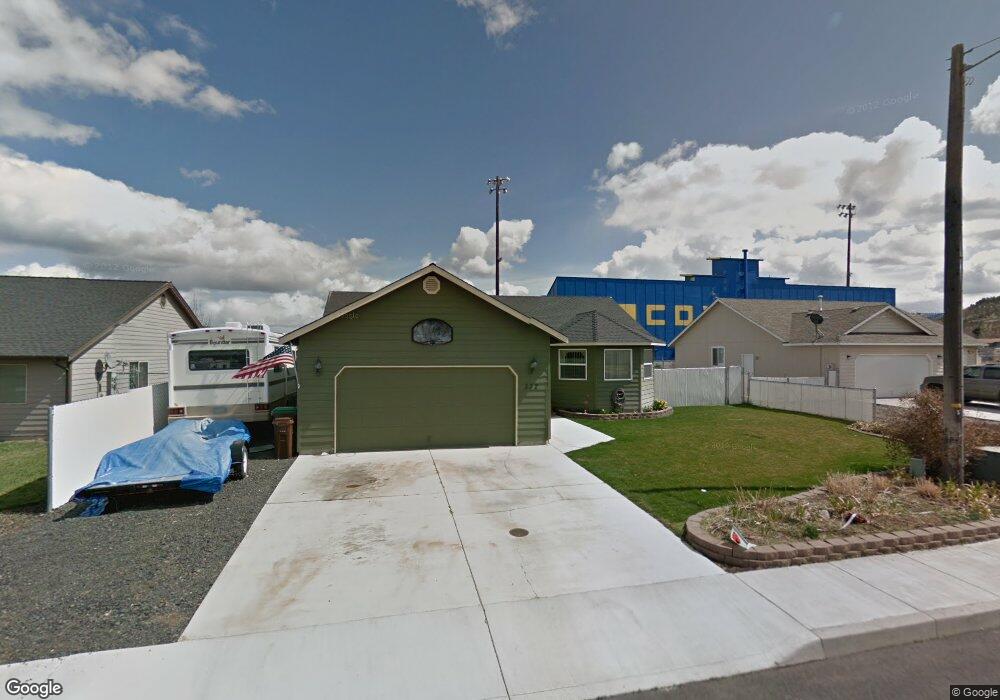
Attractive Home on Mercury: Walk to everything from this comfortable 3 bedroom 2 bath 1295 SF home. Open floor plan, large bright kitchen and dining area with slider to nice back deck. Fenced back yard has sand box and garden area. Plenty of room to park your RV.

Ownership History

Date Name Owned For Owner Type

Purchase Details

Listed on
Apr 27, 2012
Closed on
Dec 13, 2012
Sold by
Carter William E and Carter Debby
Bought by
Thorud Brent A and Thorud Terri L
Seller's Agent
Mary Doyle
Coldwell Banker Bain
Buyer's Agent
Hank Simmons
Simmons Realty
List Price
$118,000
Sold Price
$117,000
Premium/Discount to List
-$1,000
-0.85%
Current Estimated Value
$400,357

Home Financials for this Owner

Home Financials are based on the most recent Mortgage that was taken out on this home.
Estimated Appreciation
$283,357
Avg. Annual Appreciation
10.06%
Original Mortgage
$120,861
Outstanding Balance
$83,658
Interest Rate
3.35%
Mortgage Type
VA
Estimated Equity
$316,699
Source: Public Records

Range of Values:

Collateral Analytics

Collateral Analytics Collateral Analytics AVMs (Automated Valuation Model) employ a number of statistical approaches combined with neighborhood-specific comparable selection guarantees the most up-to-date and precise valuations.

Not Available

Collateral Analytics does not have data for the current month. Please view the chart for historical values.

ICE

ICE Mortgage Technology ICE Mortgage Technology’s AVM (Automated Valuation Model) is a state-of-the-art online residential property valuation tool that provides a quick and accurate estimate of the value of almost any home in the U.S.

Not Available

ICE Mortgage Technology does not have data for the current month. Please view the chart for historical values.

First American

First American First American Data & Analytics’ next-generation AVM combines unrivaled data assets with a blended ensemble of valuation models to produce highly accurate, reliable valuations you can trust.

Not Available

First American does not have data for the current month. Please view the chart for historical values.

Quantarium

Quantarium Quantarium’s valuation service, repeatedly proven the industry’s most accurate and comprehensive, is supercharged with a self-learning and auto-tuning AI engine that continually becomes smarter and more accurate as it processes daily inputs from the industry’s leading RE data lake.

Not Available

Quantarium does not have data for the current month. Please view the chart for historical values.

Average Value
Not Available
List Price
Sold Price
Create a Home Valuation Report for This Property
The Home Valuation Report is an in-depth analysis detailing your home's value as well as a comparison with similar homes in the area

Home Values in the Area

Source: Public Records

Average Home Value in this Area


Source: Public Records

Purchase History

Date Buyer Sale Price Title Company
Thorud Brent A $117,000 Amerititle
Source: Public Records

Mortgage History

Date Status Borrower Loan Amount
Open Thorud Brent A $120,861
Source: Public Records

Property History

Date Event Price List to Sale Price per Sq Ft Prior Sale
12/17/2012 12/17/12 Sold $117,000 -0.8% $90 / Sq Ft View Prior Sale
10/10/2012 10/10/12 Pending -- -- --
04/23/2012 04/23/12 For Sale $118,000 -- $91 / Sq Ft

Tax History Compared to Growth

Source: Public Records

Tax History

Year Tax Paid Tax Assessment Tax Assessment Total Assessment is a certain percentage of the fair market value that is determined by local assessors to be the total taxable value of land and additions on the property. Land Improvement
2024 $2,615 $161,090 -- --
2023 $2,526 $156,400 $0 $0
2022 $2,449 $151,850 $0 $0
2021 $2,436 $147,430 $0 $0
2020 $2,370 $143,144 $0 $0
2019 $2,290 $134,927 $0 $0
2018 $2,230 $134,927 $0 $0
2017 $2,192 $130,997 $0 $0
2016 $2,098 $123,478 $0 $0
2015 $2,011 $123,478 $0 $0
2013 -- $116,390 $0 $0
Source: Public Records

Agents Affiliated with this Home

  • Section Image
  • Section Image
See All Agents

Map