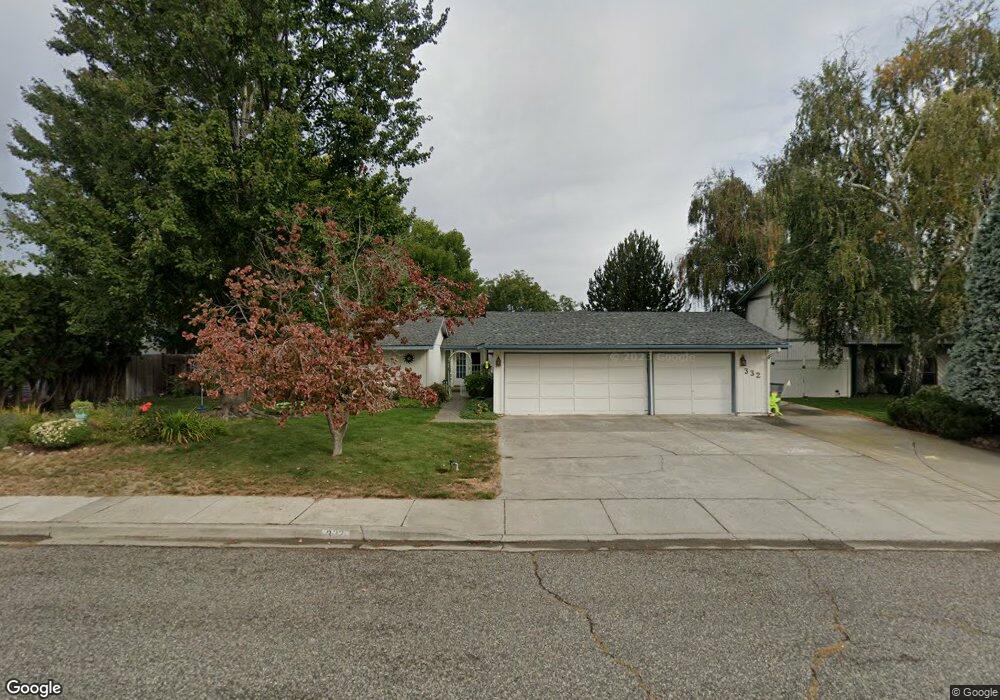
332 Skagit St Richland, WA 99354
Estimated Value: $470,084 - $547,000
4
Beds
2
Baths
2,081
Sq Ft
$241/Sq Ft
Est. Value
About This Home
This home is located at 332 Skagit St, Richland, WA 99354 and is currently estimated at $501,521, approximately $241 per square foot. 332 Skagit St is a home located in Benton County with nearby schools including Sacajawea Elementary School, Chief Joseph Middle School, and Hanford High School.
Ownership History
Date
Name
Owned For
Owner Type
Purchase Details
Closed on
Mar 29, 2013
Sold by
Mozhayev Andrey V and Mozhayeva Natalia
Bought by
Mozhayev Andrey
Current Estimated Value
Home Financials for this Owner
Home Financials are based on the most recent Mortgage that was taken out on this home.
Original Mortgage
$162,000
Interest Rate
3.54%
Mortgage Type
New Conventional
Purchase Details
Closed on
Sep 1, 2009
Sold by
Ursillo John A and Ursillo Maria
Bought by
Mozhayev Andrey
Home Financials for this Owner
Home Financials are based on the most recent Mortgage that was taken out on this home.
Original Mortgage
$188,000
Interest Rate
5.18%
Mortgage Type
New Conventional
Purchase Details
Closed on
Sep 13, 2005
Sold by
Henderson John F
Bought by
Ursillo John A and Ursillo Maria
Home Financials for this Owner
Home Financials are based on the most recent Mortgage that was taken out on this home.
Original Mortgage
$183,920
Interest Rate
1%
Mortgage Type
Fannie Mae Freddie Mac
Create a Home Valuation Report for This Property
The Home Valuation Report is an in-depth analysis detailing your home's value as well as a comparison with similar homes in the area
Home Values in the Area
Average Home Value in this Area
Purchase History
| Date | Buyer | Sale Price | Title Company |
|---|---|---|---|
| Mozhayev Andrey | -- | Cascade Title | |
| Mozhayev Andrey | $235,000 | Cascade Title | |
| Ursillo John A | $229,619 | Chicago Title |
Source: Public Records
Mortgage History
| Date | Status | Borrower | Loan Amount |
|---|---|---|---|
| Closed | Mozhayev Andrey | $162,000 | |
| Closed | Mozhayev Andrey | $188,000 | |
| Previous Owner | Ursillo John A | $183,920 |
Source: Public Records
Tax History Compared to Growth
Tax History
| Year | Tax Paid | Tax Assessment Tax Assessment Total Assessment is a certain percentage of the fair market value that is determined by local assessors to be the total taxable value of land and additions on the property. | Land | Improvement |
|---|---|---|---|---|
| 2024 | $4,150 | $453,360 | $50,000 | $403,360 |
| 2023 | $4,150 | $443,020 | $50,000 | $393,020 |
| 2022 | $3,799 | $380,960 | $50,000 | $330,960 |
| 2021 | $3,553 | $339,590 | $50,000 | $289,590 |
| 2020 | $3,216 | $308,560 | $50,000 | $258,560 |
| 2019 | $2,716 | $263,770 | $48,000 | $215,770 |
| 2018 | $2,814 | $239,800 | $48,000 | $191,800 |
| 2017 | $2,477 | $207,830 | $48,000 | $159,830 |
| 2016 | $2,441 | $207,830 | $48,000 | $159,830 |
| 2015 | $2,488 | $207,830 | $48,000 | $159,830 |
| 2014 | -- | $207,830 | $48,000 | $159,830 |
| 2013 | -- | $207,830 | $48,000 | $159,830 |
Source: Public Records
Map
Nearby Homes
- 2342 Davison Ave
- 2462 Mullet Ct
- 2445 Westmoreland Dr
- 42 Mercury Dr
- 2509 Albemarle Ct
- 49 Galaxy Ln
- 324 Saint St
- 49 Proton Ln
- 721 Hanford St
- 21 Nuclear Ln
- 45 Cosmic Ln
- 50 Compton Ln Unit 51
- 49 Compton Ln
- 2110 Davison Ave
- 733 Snyder St
- 517 Catskill St
- 515 Blue St
- 1947 Hetrick St
- 901 W Currie St
- Lot 2 Nka John Mullen Trail
- 338 Skagit St
- 326 Skagit St
- 329 Spengler St
- 401 Spengler St
- 323 Spengler St
- 344 Skagit St
- 329 Skagit St
- 335 Skagit St
- 320 Skagit St
- 407 Spengler St
- 323 Skagit St
- 315 Spengler St
- 2354 Snohomish Ave
- 350 Skagit St
- 368 Driftwood Ct
- 2355 Easton Ave
- 413 Spengler St
- 330 Spokane St
- 336 Spokane St
- 362 Driftwood Ct