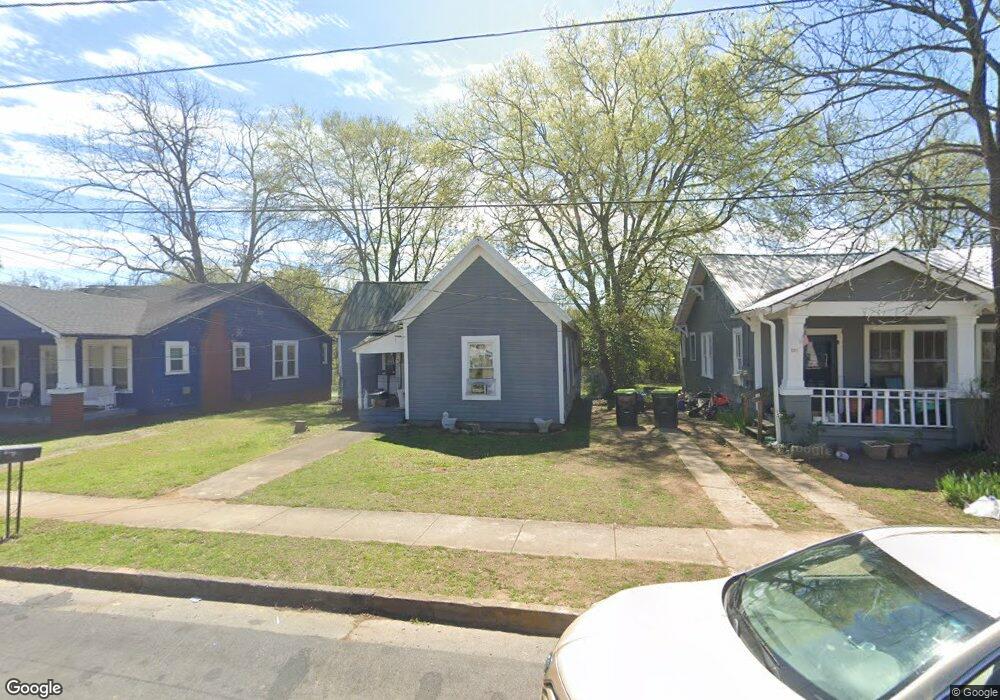
332 Stubbs St Cedartown, GA 30125
Estimated Value: $75,000 - $129,000
3
Beds
2
Baths
1,294
Sq Ft
$71/Sq Ft
Est. Value
About This Home
This home is located at 332 Stubbs St, Cedartown, GA 30125 and is currently estimated at $91,236, approximately $70 per square foot. 332 Stubbs St is a home located in Polk County with nearby schools including Cedar Christian School.
Ownership History
Date
Name
Owned For
Owner Type
Purchase Details
Closed on
Feb 3, 2003
Sold by
Smith Thomas R
Bought by
Mccain Evell
Current Estimated Value
Purchase Details
Closed on
Oct 15, 1984
Sold by
Thomas Joe U
Bought by
Smith Thomas R
Purchase Details
Closed on
Mar 30, 1982
Sold by
First Fed Savings
Bought by
Thomas Joe U
Purchase Details
Closed on
Jan 5, 1982
Sold by
Bradley Kenneth L
Bought by
First Fed Savings
Purchase Details
Closed on
Aug 10, 1979
Sold by
Holcomb Joel B
Bought by
Bradley Kenneth L
Purchase Details
Closed on
Mar 15, 1979
Sold by
Brown Leroy I
Bought by
Holcomb Joel B
Purchase Details
Closed on
Mar 9, 1979
Bought by
Brown Leroy I
Purchase Details
Closed on
Apr 1, 1978
Sold by
Brock Joe H and Brock Ruth
Bought by
Brown Leroy I
Purchase Details
Closed on
Feb 12, 1970
Sold by
Dickerson G M Mrs
Bought by
Brock Joe A and Brock Ruth
Purchase Details
Closed on
Jul 1, 1941
Bought by
Dickerson G M Mrs
Create a Home Valuation Report for This Property
The Home Valuation Report is an in-depth analysis detailing your home's value as well as a comparison with similar homes in the area
Home Values in the Area
Average Home Value in this Area
Purchase History
| Date | Buyer | Sale Price | Title Company |
|---|---|---|---|
| Mccain Evell | $10,000 | -- | |
| Smith Thomas R | -- | -- | |
| Thomas Joe U | -- | -- | |
| First Fed Savings | -- | -- | |
| Bradley Kenneth L | -- | -- | |
| Holcomb Joel B | -- | -- | |
| Brown Leroy I | -- | -- | |
| Brown Leroy I | -- | -- | |
| Brock Joe A | -- | -- | |
| Dickerson G M Mrs | -- | -- |
Source: Public Records
Tax History Compared to Growth
Tax History
| Year | Tax Paid | Tax Assessment Tax Assessment Total Assessment is a certain percentage of the fair market value that is determined by local assessors to be the total taxable value of land and additions on the property. | Land | Improvement |
|---|---|---|---|---|
| 2024 | $762 | $24,111 | $6,000 | $18,111 |
| 2023 | $546 | $15,740 | $418 | $15,322 |
| 2022 | $314 | $13,234 | $418 | $12,816 |
| 2021 | $318 | $13,234 | $418 | $12,816 |
| 2020 | $96 | $13,234 | $418 | $12,816 |
| 2019 | $5 | $4,482 | $1,141 | $3,341 |
| 2018 | $2 | $4,204 | $978 | $3,226 |
| 2017 | $2 | $4,204 | $978 | $3,226 |
| 2016 | $56 | $9,068 | $978 | $8,090 |
| 2015 | $57 | $9,158 | $978 | $8,180 |
| 2014 | $57 | $9,158 | $978 | $8,180 |
Source: Public Records
Map
Nearby Homes
- 328 330 Stubbs
- 217 E Gibson St
- 208 Highland Ave
- 537 Fletcher St
- 226 Central St
- 129 Thompson St
- 413 Line St
- 328 Mountain Home Rd
- 601 Mountain Home Rd
- 419 N Broad St
- 729 S College St
- 144 Marshall St
- 210 Merritts Ave
- 166 Marshall St
- 421 Wissahickon Ave
- 427 Wissahickon Ave
- 00 Juliette St
- 0 Philpot Springs Unit 10626665
- 234 Brooks St
- 214 Victoria Ave