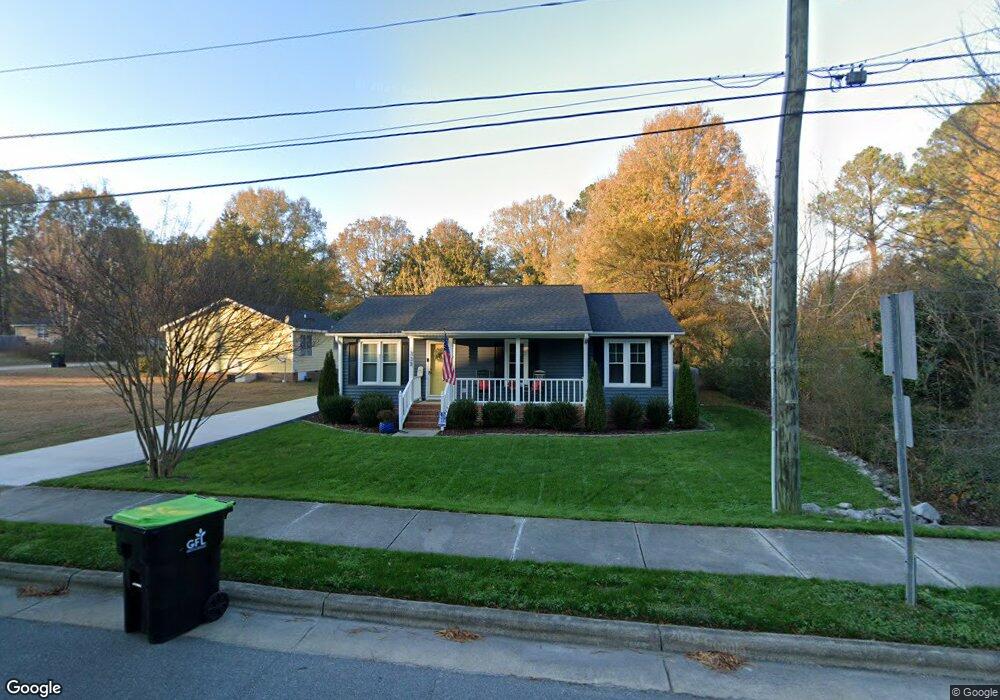
332 W Third St Wendell, NC 27591
Estimated Value: $237,000 - $275,000
3
Beds
2
Baths
1,044
Sq Ft
$241/Sq Ft
Est. Value
About This Home
This home is located at 332 W Third St, Wendell, NC 27591 and is currently estimated at $252,057, approximately $241 per square foot. 332 W Third St is a home located in Wake County with nearby schools including Wendell Elementary, Wendell Middle School, and East Wake High School.
Ownership History
Date
Name
Owned For
Owner Type
Purchase Details
Closed on
Sep 29, 2022
Sold by
Rogers Kyle William and Rogers Allyson E
Bought by
Leapley Barnes Shelley
Current Estimated Value
Home Financials for this Owner
Home Financials are based on the most recent Mortgage that was taken out on this home.
Original Mortgage
$185,000
Outstanding Balance
$173,918
Interest Rate
4%
Mortgage Type
New Conventional
Estimated Equity
$78,139
Purchase Details
Closed on
Nov 20, 2020
Sold by
Rogers Dale and Rogers Tammy
Bought by
Rogers Kyle William and Rogers Allyson Elizabeth
Home Financials for this Owner
Home Financials are based on the most recent Mortgage that was taken out on this home.
Original Mortgage
$179,000
Interest Rate
4.37%
Mortgage Type
New Conventional
Purchase Details
Closed on
Nov 15, 2019
Sold by
Laracuente Angela
Bought by
Rogers Dale and Rogers Tammy
Home Financials for this Owner
Home Financials are based on the most recent Mortgage that was taken out on this home.
Original Mortgage
$126,000
Interest Rate
3.65%
Mortgage Type
New Conventional
Purchase Details
Closed on
Jan 21, 2010
Sold by
Gardner Rope Barbour
Bought by
Laracucote Angela
Home Financials for this Owner
Home Financials are based on the most recent Mortgage that was taken out on this home.
Original Mortgage
$101,530
Interest Rate
5.02%
Mortgage Type
New Conventional
Create a Home Valuation Report for This Property
The Home Valuation Report is an in-depth analysis detailing your home's value as well as a comparison with similar homes in the area
Home Values in the Area
Average Home Value in this Area
Purchase History
| Date | Buyer | Sale Price | Title Company |
|---|---|---|---|
| Leapley Barnes Shelley | $280,000 | -- | |
| Rogers Kyle William | $177,000 | None Available | |
| Rogers Dale | $157,500 | None Available | |
| Laracucote Angela | $99,500 | None Available |
Source: Public Records
Mortgage History
| Date | Status | Borrower | Loan Amount |
|---|---|---|---|
| Open | Leapley Barnes Shelley | $185,000 | |
| Previous Owner | Rogers Kyle William | $179,000 | |
| Previous Owner | Rogers Dale | $126,000 | |
| Previous Owner | Laracucote Angela | $101,530 |
Source: Public Records
Tax History
| Year | Tax Paid | Tax Assessment Tax Assessment Total Assessment is a certain percentage of the fair market value that is determined by local assessors to be the total taxable value of land and additions on the property. | Land | Improvement |
|---|---|---|---|---|
| 2025 | $2,934 | $267,925 | $80,000 | $187,925 |
| 2024 | $2,884 | $267,925 | $80,000 | $187,925 |
Source: Public Records
Map
Nearby Homes
- 316 Wendell Falls Pkwy
- 217 N Magnolia St
- 301 City Center Ln
- 560 Stream Walk Crossing
- 242 W Academy St
- 600 Stream Walk Crossing
- 545 Stream Walk Crossing
- 111 Merle Dr
- 551 Stream Walk Crossing
- 553 Stream Walk Crossing
- 543 Stream Walk Crossing
- 549 Stream Walk Crossing
- 559 Stream Walk Crossing
- 547 Stream Walk Crossing
- 134 Merle Dr
- 142 W Haywood St
- 23 W Academy St
- 414 N Cypress St
- 2428 Rosslare Mews Ln
- 7412 Lone Silo Ln N
Your Personal Tour Guide
Ask me questions while you tour the home.