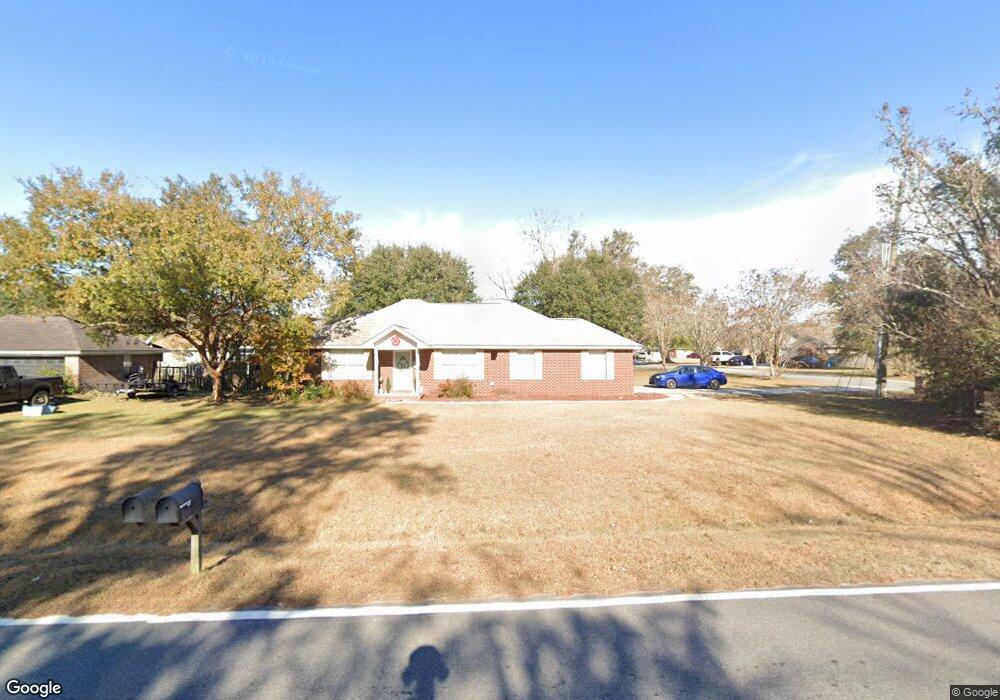
332 Weisenbaker Rd Rincon, GA 31326
Estimated Value: $283,000 - $293,400
3
Beds
2
Baths
1,427
Sq Ft
$203/Sq Ft
Est. Value
About This Home
This home is located at 332 Weisenbaker Rd, Rincon, GA 31326 and is currently estimated at $289,100, approximately $202 per square foot. 332 Weisenbaker Rd is a home located in Effingham County with nearby schools including Rincon Elementary School, Ebenezer Middle School, and Effingham County High School.
Ownership History
Date
Name
Owned For
Owner Type
Purchase Details
Closed on
Dec 30, 2025
Sold by
Valdov Vickie Lynn
Bought by
Valdov Gregory and Valdov Vickie Lynn
Current Estimated Value
Purchase Details
Closed on
Oct 5, 2016
Sold by
Davis Jeremy W and Davis Meredith H
Bought by
Dykes Jackson P
Home Financials for this Owner
Home Financials are based on the most recent Mortgage that was taken out on this home.
Original Mortgage
$139,537
Interest Rate
3.44%
Mortgage Type
New Conventional
Purchase Details
Closed on
Mar 22, 2006
Sold by
Oglesby Robert D
Bought by
Davis Jeremy W and Davis Meredith H
Home Financials for this Owner
Home Financials are based on the most recent Mortgage that was taken out on this home.
Original Mortgage
$118,400
Interest Rate
6.23%
Mortgage Type
New Conventional
Create a Home Valuation Report for This Property
The Home Valuation Report is an in-depth analysis detailing your home's value as well as a comparison with similar homes in the area
Home Values in the Area
Average Home Value in this Area
Purchase History
| Date | Buyer | Sale Price | Title Company |
|---|---|---|---|
| Valdov Gregory | $300,000 | -- | |
| Dykes Jackson P | $135,700 | -- | |
| Davis Jeremy W | $148,000 | -- |
Source: Public Records
Mortgage History
| Date | Status | Borrower | Loan Amount |
|---|---|---|---|
| Previous Owner | Dykes Jackson P | $139,537 | |
| Previous Owner | Davis Jeremy W | $118,400 | |
| Previous Owner | Davis Jeremy W | $29,600 |
Source: Public Records
Tax History
| Year | Tax Paid | Tax Assessment Tax Assessment Total Assessment is a certain percentage of the fair market value that is determined by local assessors to be the total taxable value of land and additions on the property. | Land | Improvement |
|---|---|---|---|---|
| 2025 | $1,694 | $117,006 | $22,800 | $94,206 |
| 2024 | $1,694 | $101,956 | $22,800 | $79,156 |
| 2023 | $968 | $89,102 | $17,600 | $71,502 |
| 2022 | $1,471 | $71,057 | $17,600 | $53,457 |
| 2021 | $1,450 | $66,146 | $14,000 | $52,146 |
| 2020 | $1,576 | $62,998 | $12,000 | $50,998 |
| 2019 | $1,552 | $60,948 | $12,000 | $48,948 |
| 2018 | $1,469 | $55,334 | $10,000 | $45,334 |
| 2017 | $1,461 | $52,670 | $10,000 | $42,670 |
| 2016 | $1,470 | $54,216 | $16,000 | $38,216 |
| 2015 | -- | $50,216 | $12,000 | $38,216 |
| 2014 | -- | $50,216 | $12,000 | $38,216 |
| 2013 | -- | $43,388 | $6,400 | $36,988 |
Source: Public Records
Map
Nearby Homes
- 333 Weisenbaker Rd
- 204 Pineland Dr
- 515 Weisenbaker Rd
- 201 Walthour Dr
- 0 Magnolia Dr
- 202 Walthour Dr
- 100 Spillway Ct
- 315 Jessica Ln
- 0 Hwy 21 Unit 285997
- 109 Big Cypress Ct
- 105 Saint Andrews Rd
- 305 Walthour Dr
- 201 Bailee Ave
- 141 Hayden Place
- 151 Gavin Way
- 162 Hayden Place
- 114 Stonewalk Dr
- 107 Stonewalk Dr
- 136 Fraser Ln
- 10 Michelle Ct
- 330 Weisenbaker Rd
- 314 Oxford Cir
- 123 Willowpeg Way
- 312 Oxford Cir
- 400 Weisenbaker Rd
- 328 Weisenbaker Rd
- 100 Oxford Cir
- 19 Walnut Way
- 310 Oxford Cir
- 119 Willowpeg Way
- 325 Weisenbaker Rd
- 23 Walnut Way
- 307 Oxford Cir
- 326 Weisenbaker Rd
- 101 Oxford Cir
- 305 Oxford Cir
- 402 Weisenbaker Rd
- 321 Weisenbaker Rd
- 308 Oxford Cir
- 15 Walnut Way
Your Personal Tour Guide
Ask me questions while you tour the home.