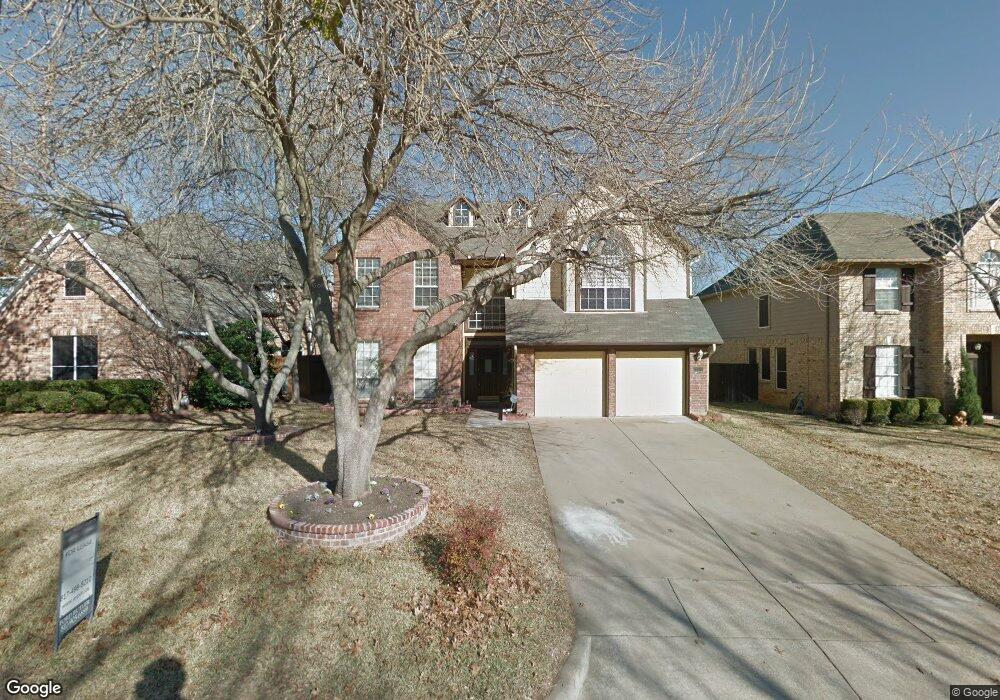
3320 Circlewood Ct Grapevine, TX 76051
Estimated Value: $561,890 - $704,000
4
Beds
3
Baths
2,619
Sq Ft
$242/Sq Ft
Est. Value
About This Home
This home is located at 3320 Circlewood Ct, Grapevine, TX 76051 and is currently estimated at $632,973, approximately $241 per square foot. 3320 Circlewood Ct is a home located in Tarrant County with nearby schools including O.C. Taylor Elementary School, Colleyville Middle School, and Waypoint Montessori.
Ownership History
Date
Name
Owned For
Owner Type
Purchase Details
Closed on
Feb 7, 2020
Sold by
Vidal Paola Sorivel and Felix Rafael Alejandro Urlas
Bought by
Ballsrud Bailey and Ballsrud Nicholas
Current Estimated Value
Home Financials for this Owner
Home Financials are based on the most recent Mortgage that was taken out on this home.
Original Mortgage
$351,500
Outstanding Balance
$312,052
Interest Rate
3.74%
Mortgage Type
New Conventional
Estimated Equity
$320,921
Purchase Details
Closed on
May 30, 2013
Sold by
Rodriguez Marcelo Gustavo
Bought by
Vidal Paola Sorivel
Purchase Details
Closed on
May 2, 2000
Sold by
Aurora Loan Services Inc
Bought by
Hud
Purchase Details
Closed on
Feb 13, 1992
Sold by
Doran John E
Bought by
Synsystems Inc
Home Financials for this Owner
Home Financials are based on the most recent Mortgage that was taken out on this home.
Original Mortgage
$106,000
Interest Rate
7.04%
Mortgage Type
Seller Take Back
Create a Home Valuation Report for This Property
The Home Valuation Report is an in-depth analysis detailing your home's value as well as a comparison with similar homes in the area
Home Values in the Area
Average Home Value in this Area
Purchase History
| Date | Buyer | Sale Price | Title Company |
|---|---|---|---|
| Ballsrud Bailey | -- | Alamo Title Company | |
| Vidal Paola Sorivel | -- | None Available | |
| Hud | -- | -- | |
| Aurora Loan Services Inc | $49,407 | -- | |
| Synsystems Inc | -- | -- |
Source: Public Records
Mortgage History
| Date | Status | Borrower | Loan Amount |
|---|---|---|---|
| Open | Ballsrud Bailey | $351,500 | |
| Previous Owner | Synsystems Inc | $106,000 |
Source: Public Records
Tax History Compared to Growth
Tax History
| Year | Tax Paid | Tax Assessment Tax Assessment Total Assessment is a certain percentage of the fair market value that is determined by local assessors to be the total taxable value of land and additions on the property. | Land | Improvement |
|---|---|---|---|---|
| 2025 | $1,928 | $444,431 | $77,550 | $366,881 |
| 2024 | $1,928 | $535,821 | $77,550 | $458,271 |
| 2023 | $7,219 | $511,151 | $77,550 | $433,601 |
| 2022 | $7,756 | $403,742 | $77,550 | $326,192 |
| 2021 | $7,738 | $355,900 | $80,000 | $275,900 |
| 2020 | $7,828 | $355,900 | $80,000 | $275,900 |
| 2019 | $8,298 | $363,859 | $80,000 | $283,859 |
| 2018 | $2,101 | $353,446 | $65,000 | $288,446 |
| 2017 | $7,581 | $327,795 | $65,000 | $262,795 |
| 2016 | $7,374 | $318,851 | $65,000 | $253,851 |
| 2015 | $5,996 | $261,400 | $28,000 | $233,400 |
| 2014 | $5,996 | $261,400 | $28,000 | $233,400 |
Source: Public Records
Map
Nearby Homes
- 3321 Circlewood Ct
- 4213 Hearthside Dr
- 4282 Hearthside Dr
- 4214 Hearthside Dr
- 3278 Birch Ave
- 3329 Moss Creek Dr
- 2906 Cottonwood Ln
- 2906 Edgewood Ln
- 5134 Post Oak Trail
- 3110 Fox Run Dr
- 3301 Queensbury Way W
- 3712 Bur Oak Dr
- 3701 Post Oak Trail
- 3904 Wagon Wheel Dr
- 2704 Yorkshire Ct
- 3409 Crossgate Cir N
- 3908 Heritage Oaks Dr
- 3712 Rothschild Blvd
- 4105 Williams Ct
- 3705 Rothschild Blvd
- 3316 Circlewood Ct
- 3324 Circlewood Ct
- 3317 Briar Cove
- 3312 Circlewood Ct
- 3321 Briar Cove
- 3313 Briar Cove
- 3317 Circlewood Ct
- 3325 Circlewood Ct
- 3329 Circlewood Ct
- 3332 Circlewood Ct
- 3313 Circlewood Ct
- 3320 Briar Cove
- 3333 Circlewood Ct
- 3337 Circlewood Ct
- 3316 Briar Cove
- 3337 Summerfield Dr
- 4225 Rustic Dr
- 3320 Shadow Ridge
- 3333 Summerfield Dr
- 3316 Shadow Ridge