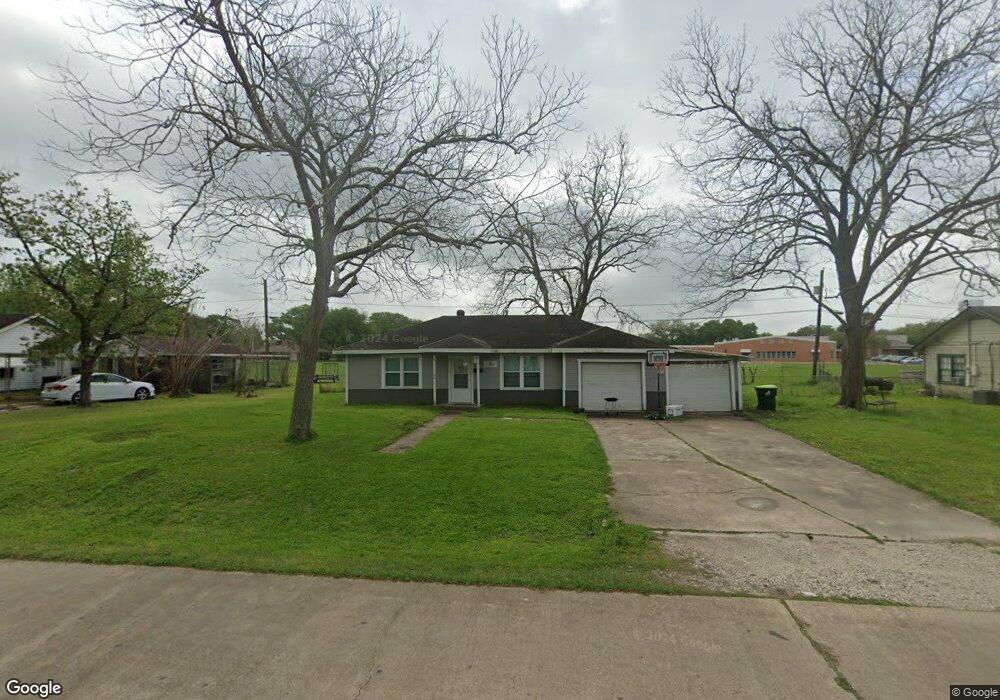
3320 Doris St Bay City, TX 77414
Estimated Value: $115,893 - $163,000
--
Bed
--
Bath
1,014
Sq Ft
$130/Sq Ft
Est. Value
About This Home
This home is located at 3320 Doris St, Bay City, TX 77414 and is currently estimated at $131,473, approximately $129 per square foot. 3320 Doris St is a home located in Matagorda County with nearby schools including John H. Cherry Elementary School, Bay City Junior High School, and Bay City High School.
Ownership History
Date
Name
Owned For
Owner Type
Purchase Details
Closed on
Oct 6, 2016
Sold by
Eidlebach Arthur C and Eidlebach Carmen
Bought by
Chambless Glenn M and Chambless Karma M
Current Estimated Value
Home Financials for this Owner
Home Financials are based on the most recent Mortgage that was taken out on this home.
Original Mortgage
$52,780
Outstanding Balance
$24,709
Interest Rate
3.43%
Mortgage Type
Construction
Estimated Equity
$106,764
Create a Home Valuation Report for This Property
The Home Valuation Report is an in-depth analysis detailing your home's value as well as a comparison with similar homes in the area
Home Values in the Area
Average Home Value in this Area
Purchase History
| Date | Buyer | Sale Price | Title Company |
|---|---|---|---|
| Chambless Glenn M | -- | Southwest Land Title |
Source: Public Records
Mortgage History
| Date | Status | Borrower | Loan Amount |
|---|---|---|---|
| Open | Chambless Glenn M | $52,780 |
Source: Public Records
Tax History Compared to Growth
Tax History
| Year | Tax Paid | Tax Assessment Tax Assessment Total Assessment is a certain percentage of the fair market value that is determined by local assessors to be the total taxable value of land and additions on the property. | Land | Improvement |
|---|---|---|---|---|
| 2024 | $26 | $110,160 | $29,840 | $80,320 |
| 2023 | $2,333 | $100,140 | $14,840 | $85,300 |
| 2022 | $1,760 | $65,890 | $10,710 | $55,180 |
| 2021 | $1,812 | $61,670 | $10,710 | $50,960 |
| 2020 | $1,664 | $54,450 | $10,710 | $43,740 |
| 2019 | $1,702 | $55,710 | $10,710 | $45,000 |
| 2018 | $1,660 | $56,350 | $10,710 | $45,640 |
| 2017 | $1,573 | $56,350 | $10,710 | $45,640 |
| 2016 | $1,450 | $51,920 | $10,710 | $41,210 |
| 2015 | -- | $49,380 | $10,710 | $38,670 |
| 2014 | -- | $44,940 | $10,710 | $34,230 |
Source: Public Records
Map
Nearby Homes