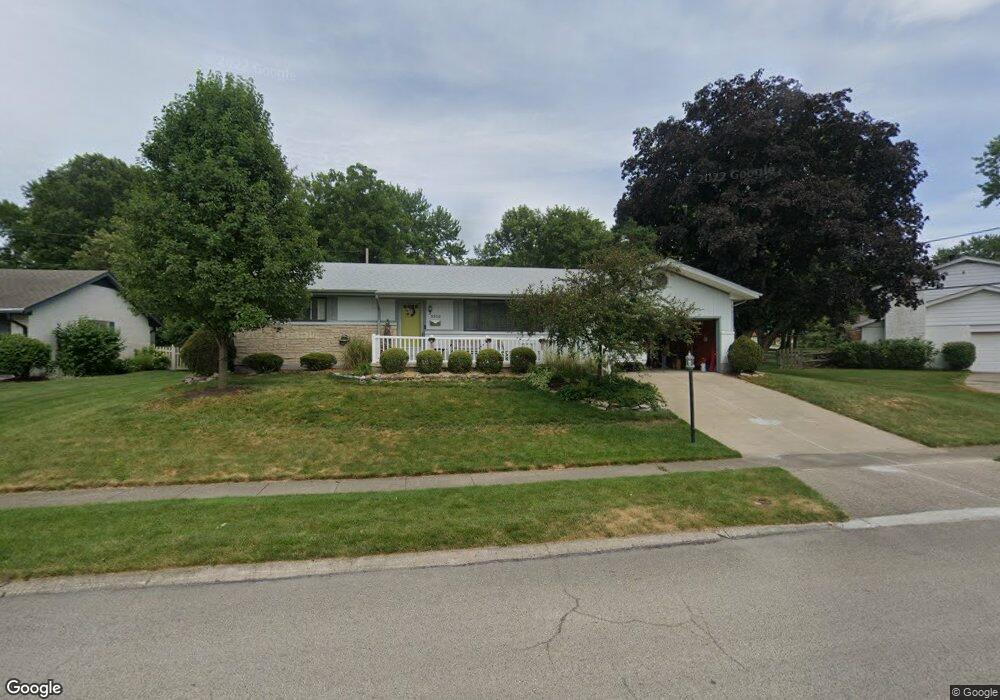
3320 Highgrove Place Dayton, OH 45429
Estimated Value: $293,000 - $312,000
3
Beds
3
Baths
1,580
Sq Ft
$193/Sq Ft
Est. Value
About This Home
This home is located at 3320 Highgrove Place, Dayton, OH 45429 and is currently estimated at $304,950, approximately $193 per square foot. 3320 Highgrove Place is a home located in Montgomery County with nearby schools including Orchard Park Elementary School, Van Buren Middle School, and Kettering Fairmont High School.
Ownership History
Date
Name
Owned For
Owner Type
Purchase Details
Closed on
May 5, 2023
Sold by
Miller Sean D and Miller Samantha L
Bought by
Thomas Jeffrey M and Thomas Jennifer A
Current Estimated Value
Home Financials for this Owner
Home Financials are based on the most recent Mortgage that was taken out on this home.
Original Mortgage
$264,000
Outstanding Balance
$256,511
Interest Rate
6.28%
Mortgage Type
New Conventional
Estimated Equity
$48,439
Purchase Details
Closed on
Nov 18, 2011
Sold by
Patton Paula L
Bought by
Saltar Joshua S and Saltar Anna E
Home Financials for this Owner
Home Financials are based on the most recent Mortgage that was taken out on this home.
Original Mortgage
$145,292
Interest Rate
3.97%
Mortgage Type
Purchase Money Mortgage
Purchase Details
Closed on
May 18, 2010
Sold by
Patton Paula L
Bought by
Patton Paula L
Create a Home Valuation Report for This Property
The Home Valuation Report is an in-depth analysis detailing your home's value as well as a comparison with similar homes in the area
Home Values in the Area
Average Home Value in this Area
Purchase History
| Date | Buyer | Sale Price | Title Company |
|---|---|---|---|
| Thomas Jeffrey M | $289,000 | None Listed On Document | |
| Saltar Joshua S | $147,500 | Attorney | |
| Patton Paula L | -- | None Available |
Source: Public Records
Mortgage History
| Date | Status | Borrower | Loan Amount |
|---|---|---|---|
| Open | Thomas Jeffrey M | $264,000 | |
| Previous Owner | Saltar Joshua S | $145,292 |
Source: Public Records
Tax History Compared to Growth
Tax History
| Year | Tax Paid | Tax Assessment Tax Assessment Total Assessment is a certain percentage of the fair market value that is determined by local assessors to be the total taxable value of land and additions on the property. | Land | Improvement |
|---|---|---|---|---|
| 2024 | $4,135 | $84,980 | $15,790 | $69,190 |
| 2023 | $4,135 | $84,980 | $15,790 | $69,190 |
| 2022 | $3,485 | $61,900 | $11,530 | $50,370 |
| 2021 | $3,223 | $61,900 | $11,530 | $50,370 |
| 2020 | $3,234 | $61,900 | $11,530 | $50,370 |
| 2019 | $2,288 | $45,210 | $10,970 | $34,240 |
| 2018 | $2,300 | $45,210 | $10,970 | $34,240 |
| 2017 | $2,119 | $45,210 | $10,970 | $34,240 |
| 2016 | $3,756 | $46,360 | $10,970 | $35,390 |
| 2015 | $3,588 | $46,360 | $10,970 | $35,390 |
| 2014 | $3,588 | $46,360 | $10,970 | $35,390 |
| 2012 | -- | $45,670 | $11,000 | $34,670 |
Source: Public Records
Map
Nearby Homes
- 900 Garrison Ave
- 3200 Oakmont Ave
- 3209 Waltham Ave
- 856 Timberlake Ct
- 861 Timberlake Ct
- 3198 Sagamon Ave Unit 13198
- 813 Rockhill Ave
- 855 Brookfield Rd
- 3309 Sharon Ave
- 1224 Devon Ave
- 1304 Devon Ave
- 2905 Acorn Dr
- 3822 Milford Dr
- 645 Brookfield Rd
- 587 Cottingwood Ct
- 709 E Dorothy Ln
- 3872 Maryknoll Dr
- 2820 Wehrly Ave
- 3725 Claybourne Rd
- 551 Cottingwood Ct
- 3316 Highgrove Place
- 3324 Highgrove Place
- 3331 Waltham Ave
- 3325 Waltham Ave
- 3325 Waltham Ave Unit Kettering
- 983 Shelton Dr
- 3323 Highgrove Place
- 3327 Highgrove Place
- 3312 Highgrove Place
- 3319 Highgrove Place
- 3319 Waltham Ave
- 3315 Highgrove Place
- 919 Shelton Dr
- 960 Shelton Dr
- 972 Shelton Dr
- 3308 Highgrove Place
- 3313 Waltham Ave
- 948 Shelton Dr
- 3324 Carrier Ave
- 3330 Waltham Ave