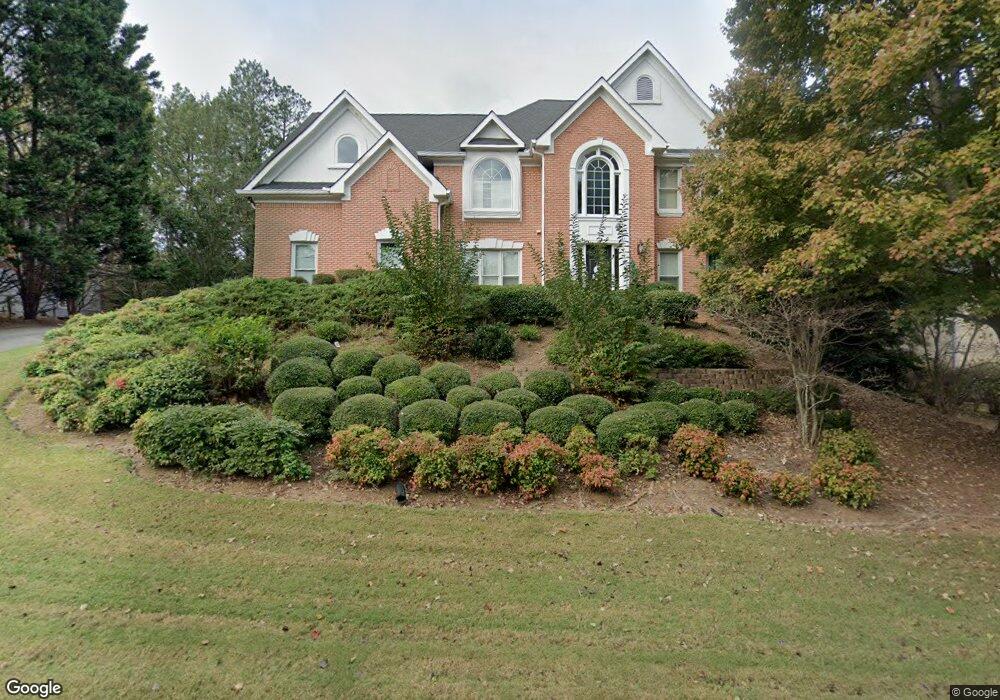
3320 Merganser Ln Unit 1 Alpharetta, GA 30022
Newtown NeighborhoodEstimated Value: $776,000 - $886,000
4
Beds
4
Baths
3,606
Sq Ft
$229/Sq Ft
Est. Value
About This Home
This home is located at 3320 Merganser Ln Unit 1, Alpharetta, GA 30022 and is currently estimated at $825,414, approximately $228 per square foot. 3320 Merganser Ln Unit 1 is a home located in Fulton County with nearby schools including Barnwell Elementary School, Haynes Bridge Middle School, and Centennial High School.
Ownership History
Date
Name
Owned For
Owner Type
Purchase Details
Closed on
Oct 27, 2006
Sold by
Vedlitz Andrew and Vedlitz Beth G
Bought by
Smith Chris and Smith Inga
Current Estimated Value
Home Financials for this Owner
Home Financials are based on the most recent Mortgage that was taken out on this home.
Original Mortgage
$341,440
Outstanding Balance
$198,189
Interest Rate
5.88%
Mortgage Type
New Conventional
Estimated Equity
$627,225
Purchase Details
Closed on
Jun 30, 2004
Sold by
Lehman Herbert S and Lehman Linda
Bought by
Vedlitz Beth G and Vedlitz Adrew
Home Financials for this Owner
Home Financials are based on the most recent Mortgage that was taken out on this home.
Original Mortgage
$322,800
Interest Rate
5.25%
Mortgage Type
New Conventional
Purchase Details
Closed on
Sep 1, 1994
Sold by
Cornerstone Craftsmen Inc
Bought by
Lehman Herbert S Linda J
Home Financials for this Owner
Home Financials are based on the most recent Mortgage that was taken out on this home.
Original Mortgage
$100,000
Interest Rate
8.56%
Create a Home Valuation Report for This Property
The Home Valuation Report is an in-depth analysis detailing your home's value as well as a comparison with similar homes in the area
Home Values in the Area
Average Home Value in this Area
Purchase History
| Date | Buyer | Sale Price | Title Company |
|---|---|---|---|
| Smith Chris | $426,800 | -- | |
| Vedlitz Beth G | $403,600 | -- | |
| Lehman Herbert S Linda J | -- | -- |
Source: Public Records
Mortgage History
| Date | Status | Borrower | Loan Amount |
|---|---|---|---|
| Open | Smith Chris | $341,440 | |
| Previous Owner | Vedlitz Beth G | $322,800 | |
| Previous Owner | Lehman Herbert S Linda J | $100,000 |
Source: Public Records
Tax History Compared to Growth
Tax History
| Year | Tax Paid | Tax Assessment Tax Assessment Total Assessment is a certain percentage of the fair market value that is determined by local assessors to be the total taxable value of land and additions on the property. | Land | Improvement |
|---|---|---|---|---|
| 2025 | $5,360 | $247,600 | $56,560 | $191,040 |
| 2023 | $5,133 | $181,840 | $40,440 | $141,400 |
| 2022 | $5,035 | $181,840 | $40,440 | $141,400 |
| 2021 | $5,085 | $189,160 | $44,640 | $144,520 |
| 2020 | $5,128 | $187,520 | $35,440 | $152,080 |
| 2019 | $598 | $184,240 | $34,840 | $149,400 |
| 2018 | $5,406 | $179,920 | $34,000 | $145,920 |
| 2017 | $4,915 | $156,560 | $36,200 | $120,360 |
| 2016 | $4,836 | $156,560 | $36,200 | $120,360 |
| 2015 | $4,889 | $156,560 | $36,200 | $120,360 |
| 2014 | $4,279 | $134,360 | $31,080 | $103,280 |
Source: Public Records
Map
Nearby Homes
- 3535 Merganser Ln Unit 2
- 3450 Merganser Ln
- 9510 Stoney Ridge Ln
- 150 Stoney Ridge Dr
- 835 Kings Arms Way
- 9675 Almaviva Dr
- 375 N Peak Dr
- 9320 Brumbelow Crossing Way
- 9695 Almaviva Dr
- 352 N Peak Dr
- 9715 Almaviva Dr
- 235 Stoney Ridge Dr
- 340 Mount Mitchell Way
- 140 Old Sandhurst Landing
- 545 Oak Bridge Trail
- 710 Leeds Garden Terrace
- 515 Oak Bridge Trail
- 615 S Preston Ct
- 3330 Merganser Ln
- 3310 Merganser Ln
- 3365 Merganser Ln
- 0 Brumbelow Rd Unit 10290845
- 0 Brumbelow Rd Unit 7379377
- 0 Brumbelow Rd Unit 7069622
- 0 Brumbelow Rd Unit 8065930
- 0 Brumbelow Rd Unit 7445496
- 135 Knighthood Ct
- 3340 Merganser Ln
- 3290 Hartridge Dr
- 3350 Merganser Ln
- 3350 Merganser Ln Unit N/A
- 145 Knighthood Ct
- 3375 Merganser Ln
- 3360 Merganser Ln
- 125 Cupit Close Unit 1
- 125 Knighthood Ct
- 3290 Merganser Ln
- 0 Mallard Lake Place Unit 7499802