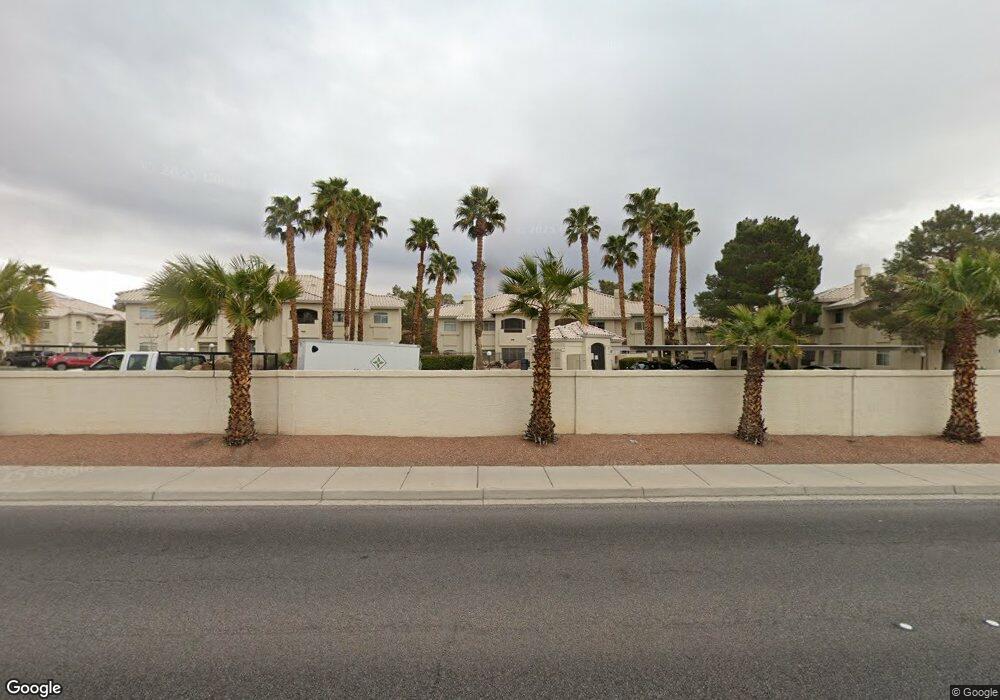
Palisades Point 3320 S Fort Apache Rd Unit 225 Las Vegas, NV 89117
Rancho Viejo NeighborhoodEstimated Value: $238,675 - $278,000
2
Beds
2
Baths
1,149
Sq Ft
$223/Sq Ft
Est. Value
About This Home
This home is located at 3320 S Fort Apache Rd Unit 225, Las Vegas, NV 89117 and is currently estimated at $255,919, approximately $222 per square foot. 3320 S Fort Apache Rd Unit 225 is a home located in Clark County with nearby schools including Patricia A Bendorf Elementary School, Clifford J Lawrence Junior High School, and Spring Valley High School.
Ownership History
Date
Name
Owned For
Owner Type
Purchase Details
Closed on
Jul 29, 2024
Sold by
Ling Faye Jue and Ling James Elbert
Bought by
Escobar Tracy
Current Estimated Value
Home Financials for this Owner
Home Financials are based on the most recent Mortgage that was taken out on this home.
Original Mortgage
$195,000
Outstanding Balance
$192,793
Interest Rate
6.87%
Mortgage Type
New Conventional
Estimated Equity
$63,126
Purchase Details
Closed on
Jun 15, 2000
Sold by
Ling James Elbert and Ling Faye Jue
Bought by
Ling James Elbert and Ling Faye Jue
Purchase Details
Closed on
Mar 2, 2000
Sold by
Lichtenauer Chiu
Bought by
Ling James E and Ling Faye J
Purchase Details
Closed on
Jul 27, 1999
Sold by
Kay Mai Tam
Bought by
Lichtenauer Chiu
Home Financials for this Owner
Home Financials are based on the most recent Mortgage that was taken out on this home.
Original Mortgage
$75,000
Interest Rate
7.64%
Mortgage Type
Seller Take Back
Create a Home Valuation Report for This Property
The Home Valuation Report is an in-depth analysis detailing your home's value as well as a comparison with similar homes in the area
Home Values in the Area
Average Home Value in this Area
Purchase History
| Date | Buyer | Sale Price | Title Company |
|---|---|---|---|
| Escobar Tracy | $205,000 | Ticor Title | |
| Ling James Elbert | -- | -- | |
| Ling James E | $85,000 | Fidelity National Title | |
| Lichtenauer Chiu | $85,000 | Old Republic Title Company |
Source: Public Records
Mortgage History
| Date | Status | Borrower | Loan Amount |
|---|---|---|---|
| Open | Escobar Tracy | $195,000 | |
| Previous Owner | Lichtenauer Chiu | $75,000 |
Source: Public Records
Tax History Compared to Growth
Tax History
| Year | Tax Paid | Tax Assessment Tax Assessment Total Assessment is a certain percentage of the fair market value that is determined by local assessors to be the total taxable value of land and additions on the property. | Land | Improvement |
|---|---|---|---|---|
| 2025 | $801 | $51,448 | $21,000 | $30,448 |
| 2024 | $778 | $51,448 | $21,000 | $30,448 |
| 2023 | $815 | $49,959 | $21,700 | $28,259 |
| 2022 | $792 | $45,825 | $19,600 | $26,225 |
| 2021 | $733 | $43,003 | $17,500 | $25,503 |
| 2020 | $709 | $42,946 | $17,500 | $25,446 |
| 2019 | $700 | $40,746 | $15,400 | $25,346 |
| 2018 | $668 | $33,559 | $8,750 | $24,809 |
| 2017 | $962 | $32,813 | $7,350 | $25,463 |
| 2016 | $634 | $30,958 | $5,250 | $25,708 |
| 2015 | $633 | $24,305 | $4,550 | $19,755 |
| 2014 | $613 | $20,283 | $5,250 | $15,033 |
Source: Public Records
About Palisades Point
Map
Nearby Homes
- 3320 S Fort Apache Rd Unit 239
- 3320 S Fort Apache Rd Unit 218
- 9325 Scenic Mountain Ln
- 9340 Horizon Vista Ln
- 9325 W Desert Inn Rd Unit 177
- 9325 W Desert Inn Rd Unit 124
- 9325 W Desert Inn Rd Unit 110
- 9325 W Desert Inn Rd Unit 109
- 9325 W Desert Inn Rd Unit 141
- 9325 W Desert Inn Rd Unit 143
- 9333 Dry Dock Dr
- 9288 Horizon Vista Ln
- 3340 Shallow Pond Dr
- 3327 Erva St Unit 233
- 9305 Alameda Harbor Ave
- 3220 Ventana Hills Dr
- 9334 Peace Pipe Ct
- 9105 Cypress Point Way
- 3324 Canyon Lake Dr
- 9270 Apache Springs Dr
- 3320 S Fort Apache Rd Unit 115
- 3320 S Fort Apache Rd Unit 131
- 3320 S Fort Apache Rd Unit 238
- 3320 S Fort Apache Rd Unit 235
- 3320 S Fort Apache Rd Unit 226
- 3320 S Fort Apache Rd Unit 102
- 3320 S Fort Apache Rd Unit 210
- 3320 S Fort Apache Rd Unit 233
- 3320 S Fort Apache Rd Unit 219
- 3320 S Fort Apache Rd Unit 228
- 3320 S Fort Apache Rd Unit 117
- 3320 S Fort Apache Rd Unit 134
- 3320 S Fort Apache Rd Unit 216
- 3320 S Fort Apache Rd Unit 215
- 3320 S Fort Apache Rd Unit 110
- 3320 S Fort Apache Rd Unit 126
- 3320 S Fort Apache Rd Unit 234
- 3320 S Fort Apache Rd Unit 105
- 3320 S Fort Apache Rd Unit 140
- 3320 S Fort Apache Rd Unit 123