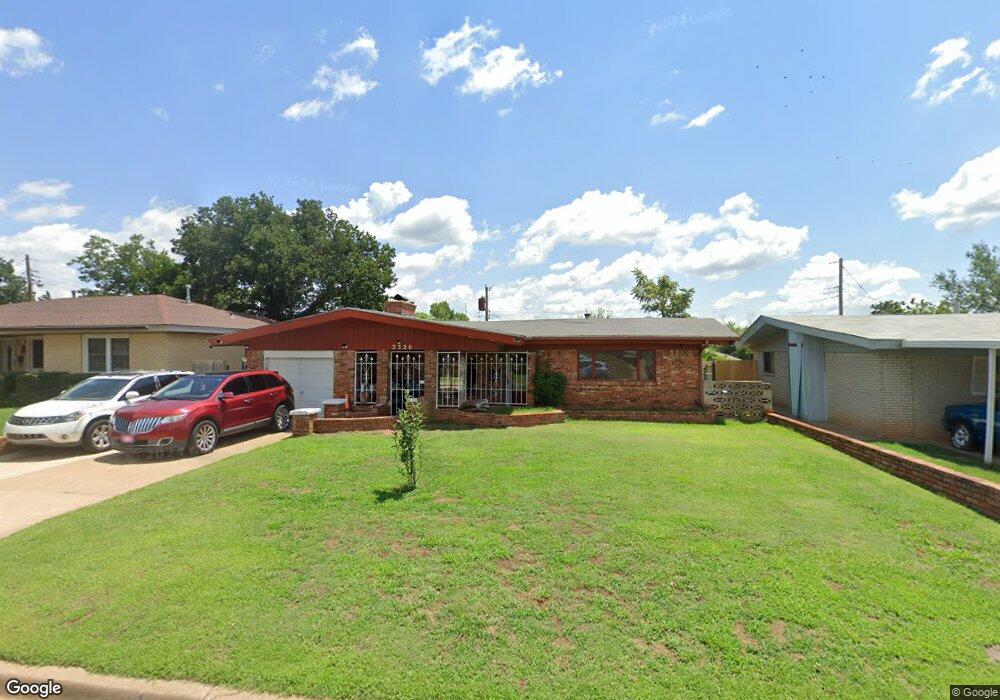
3320 Sherman Ave Oklahoma City, OK 73111
Northeast Park NeighborhoodEstimated Value: $122,000 - $170,000
2
Beds
2
Baths
1,386
Sq Ft
$98/Sq Ft
Est. Value
About This Home
This home is located at 3320 Sherman Ave, Oklahoma City, OK 73111 and is currently estimated at $136,343, approximately $98 per square foot. 3320 Sherman Ave is a home located in Oklahoma County with nearby schools including Thelma R. Parks Elementary School, Moon Middle School, and F.D. Moon Middle School.
Ownership History
Date
Name
Owned For
Owner Type
Purchase Details
Closed on
Jun 3, 2021
Sold by
3320 Sherman Ave Llc
Bought by
11 11 Investments Llc
Current Estimated Value
Purchase Details
Closed on
Mar 29, 2017
Sold by
Lrg Properties
Bought by
11:11 Investments Llc
Purchase Details
Closed on
Dec 29, 2016
Sold by
Ditech Financial Llc and Street Sandra S
Bought by
Lrg Properties Llc
Home Financials for this Owner
Home Financials are based on the most recent Mortgage that was taken out on this home.
Original Mortgage
$30,000
Interest Rate
4.03%
Mortgage Type
Stand Alone Refi Refinance Of Original Loan
Purchase Details
Closed on
Dec 30, 2003
Sold by
Riley Yolanda and Braggs Yolanda
Bought by
Street Sandra S
Purchase Details
Closed on
Dec 1, 2003
Sold by
Braggs Fred Otis and Braggs Fred
Bought by
Riley Yolanda and Braggs Yolanda
Create a Home Valuation Report for This Property
The Home Valuation Report is an in-depth analysis detailing your home's value as well as a comparison with similar homes in the area
Home Values in the Area
Average Home Value in this Area
Purchase History
| Date | Buyer | Sale Price | Title Company |
|---|---|---|---|
| 11 11 Investments Llc | -- | Oklahoma City Abstract & Ttl | |
| 11:11 Investments Llc | -- | None Available | |
| Lrg Properties Llc | -- | None Available | |
| Street Sandra S | $53,000 | Lawyers Title Of Ok City Inc | |
| Riley Yolanda | -- | -- |
Source: Public Records
Mortgage History
| Date | Status | Borrower | Loan Amount |
|---|---|---|---|
| Previous Owner | 3320 Sherman Ave Llc | $52,000 | |
| Previous Owner | Lrg Properties Llc | $30,000 | |
| Previous Owner | Street Sandra S | $63,000 |
Source: Public Records
Tax History Compared to Growth
Tax History
| Year | Tax Paid | Tax Assessment Tax Assessment Total Assessment is a certain percentage of the fair market value that is determined by local assessors to be the total taxable value of land and additions on the property. | Land | Improvement |
|---|---|---|---|---|
| 2024 | $1,093 | $8,824 | $943 | $7,881 |
| 2023 | $1,032 | $8,404 | $1,005 | $7,399 |
| 2022 | $942 | $8,004 | $1,235 | $6,769 |
| 2021 | $897 | $7,623 | $1,420 | $6,203 |
| 2020 | $865 | $7,260 | $181 | $7,079 |
| 2019 | $844 | $7,095 | $181 | $6,914 |
| 2018 | $799 | $7,040 | $0 | $0 |
| 2017 | $711 | $6,269 | $181 | $6,088 |
| 2016 | $724 | $6,379 | $181 | $6,198 |
| 2015 | $740 | $6,459 | $181 | $6,278 |
| 2014 | $835 | $7,338 | $181 | $7,157 |
Source: Public Records
Map
Nearby Homes
- 1437 NE 33rd St
- 1437 NE 34th St
- 3601 N Terry Ave
- 1221 NE 33rd St
- 3512 N Rhode Island Ave
- 1714 NE 34th St
- 1435 NE 27th St
- 1400 NE 27th St
- 1504 NE 27th St
- 1500 NE 27th St
- 1433 NE 26th St
- 1416 NE 39th St
- 925 NE 31st St
- 2605 N Kate Ave
- 3600 Springlake Dr
- 1237 Staton Dr
- 1516 NE 25th St
- 3600 N Laird Ave
- 913 NE 28th St
- 846 Marilyn St
- 3324 Sherman Ave
- 3316 Sherman Ave
- 3321 Sherman Terrace
- 3325 Sherman Terrace
- 3328 Sherman Ave
- 3312 Sherman Ave
- 3321 Sherman Ave
- 1408 NE 33rd St
- 3317 Sherman Ave
- 3325 Sherman Ave
- 1412 NE 33rd St
- 3313 Sherman Ave
- 1400 NE 33rd St
- 3309 Sherman Ave
- 1416 NE 33rd St
- 3320 Sherman Terrace
- 3316 Sherman Terrace
- 3324 Sherman Terrace
- 3312 Sherman Terrace
- 3328 Sherman Terrace