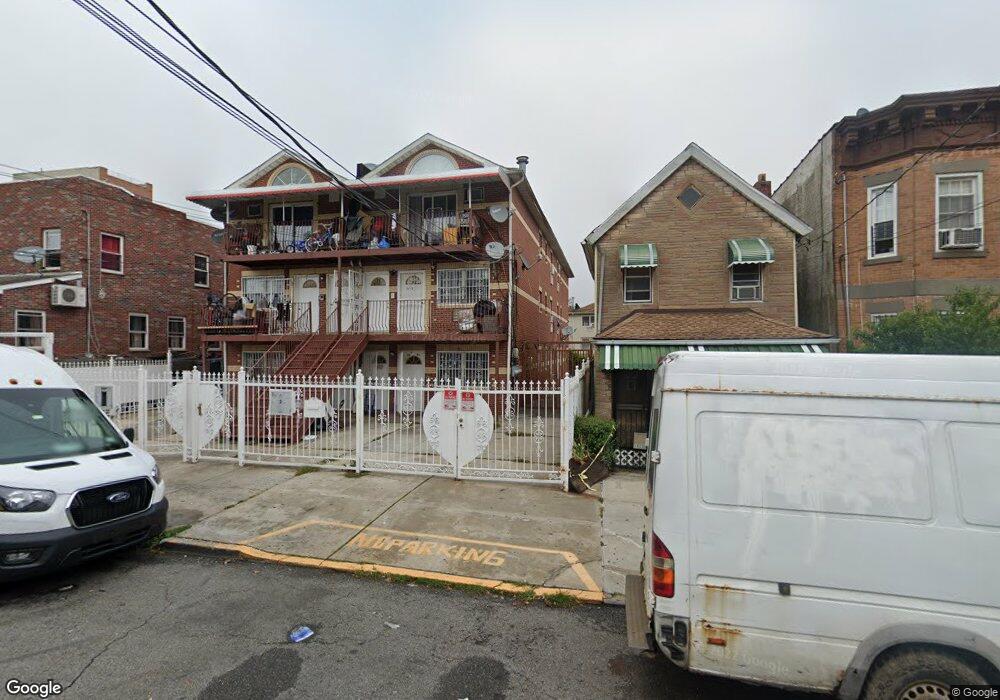
3321 100th St Corona, NY 11368
Corona NeighborhoodEstimated Value: $1,489,000 - $2,080,000
Studio
--
Bath
4,050
Sq Ft
$433/Sq Ft
Est. Value
About This Home
This home is located at 3321 100th St, Corona, NY 11368 and is currently estimated at $1,755,667, approximately $433 per square foot. 3321 100th St is a home located in Queens County with nearby schools including P.S. 92 Harry T. Stewart Sr. School, I.S. 145 Joseph Pulitzer Magnet School, and Flushing High School.
Ownership History
Date
Name
Owned For
Owner Type
Purchase Details
Closed on
Oct 27, 2023
Sold by
Palaguachi De Paredes Maria E and Paredes Miguel
Bought by
Huerta Maria and Paredes Miguel
Current Estimated Value
Purchase Details
Closed on
Aug 10, 2017
Sold by
Paredes Miguel
Bought by
Palaguachi De Paredes Maria E and Paredes Miguel
Purchase Details
Closed on
Apr 29, 2002
Sold by
Buitrago Andres C
Bought by
Manhasset Homes Corp
Home Financials for this Owner
Home Financials are based on the most recent Mortgage that was taken out on this home.
Original Mortgage
$380,000
Interest Rate
6.73%
Mortgage Type
Purchase Money Mortgage
Purchase Details
Closed on
Oct 10, 1998
Sold by
Koch Glen J and The Estate Of Gola M Barrow
Bought by
Buitrago Andres C
Home Financials for this Owner
Home Financials are based on the most recent Mortgage that was taken out on this home.
Original Mortgage
$209,000
Interest Rate
6.85%
Mortgage Type
Purchase Money Mortgage
Create a Home Valuation Report for This Property
The Home Valuation Report is an in-depth analysis detailing your home's value as well as a comparison with similar homes in the area
Home Values in the Area
Average Home Value in this Area
Purchase History
| Date | Buyer | Sale Price | Title Company |
|---|---|---|---|
| Huerta Maria | -- | -- | |
| Palaguachi De Paredes Maria E | -- | -- | |
| Manhasset Homes Corp | -- | -- | |
| Buitrago Andres C | $220,000 | First American Title Ins Co |
Source: Public Records
Mortgage History
| Date | Status | Borrower | Loan Amount |
|---|---|---|---|
| Previous Owner | Manhasset Homes Corp | $380,000 | |
| Previous Owner | Buitrago Andres C | $209,000 |
Source: Public Records
Tax History
| Year | Tax Paid | Tax Assessment Tax Assessment Total Assessment is a certain percentage of the fair market value that is determined by local assessors to be the total taxable value of land and additions on the property. | Land | Improvement |
|---|---|---|---|---|
| 2025 | $12,738 | $67,222 | $11,255 | $55,967 |
| 2024 | $12,738 | $63,418 | $9,975 | $53,443 |
| 2023 | $12,338 | $61,430 | $8,339 | $53,091 |
| 2022 | $12,177 | $91,620 | $13,080 | $78,540 |
| 2021 | $12,496 | $81,960 | $13,080 | $68,880 |
| 2020 | $11,857 | $70,500 | $13,080 | $57,420 |
| 2019 | $9,193 | $75,000 | $13,080 | $61,920 |
| 2018 | $6,941 | $51,192 | $9,530 | $41,662 |
| 2017 | $5,165 | $50,832 | $8,363 | $42,469 |
| 2016 | $3,312 | $50,832 | $8,363 | $42,469 |
| 2015 | $1,138 | $46,682 | $10,955 | $35,727 |
| 2014 | $1,138 | $44,040 | $12,180 | $31,860 |
Source: Public Records
Map
Nearby Homes
- 32-48 101st St
- 99-03 Northern Blvd
- 3354 99th St
- 9815 34th Ave
- 32-43 98th St
- 32-26 103rd St
- 3416 103rd St
- 3417 103rd St Unit 103+P6
- 97-16 32nd Ave
- 9612 34th Ave
- 96-06 34th Ave
- 35-13 103rd St
- 104-16 32nd Ave
- 35-28 103rd St
- 32-45 105th St
- 35-44 100th St
- 31-11 101st St
- 31-14 102nd St
- 3223 95th St
- 3260 106th St Unit 2C
Your Personal Tour Guide
Ask me questions while you tour the home.