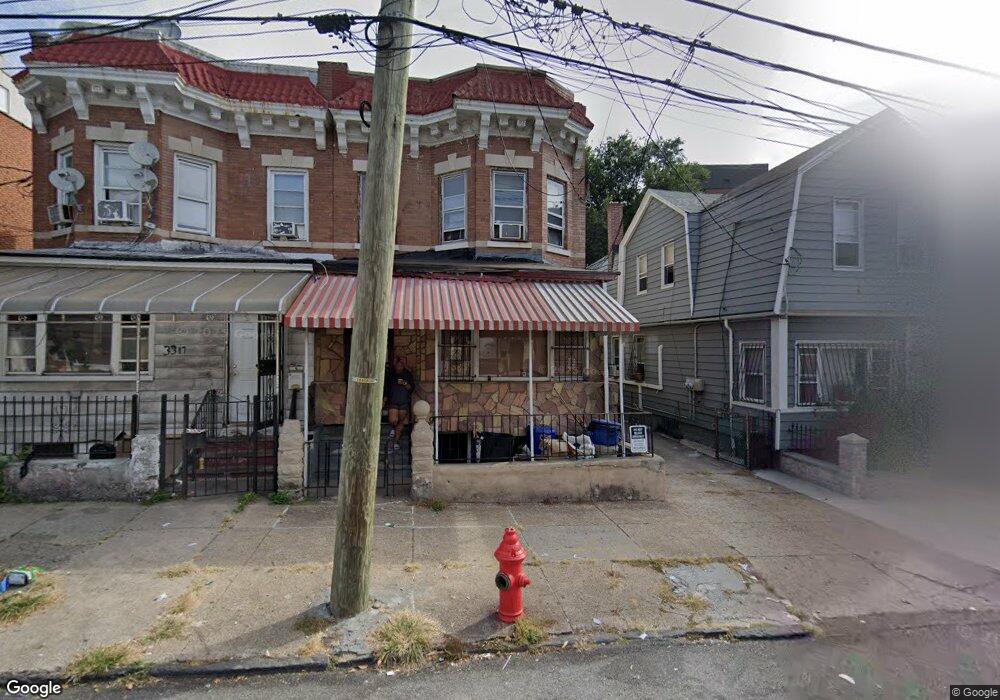
3321 112th St Corona, NY 11368
Corona NeighborhoodEstimated Value: $1,000,000 - $1,058,000
Studio
--
Bath
1,340
Sq Ft
$772/Sq Ft
Est. Value
About This Home
This home is located at 3321 112th St, Corona, NY 11368 and is currently estimated at $1,034,667, approximately $772 per square foot. 3321 112th St is a home located in Queens County with nearby schools including Helen M Marshall School, Corona Arts And Sciences Academy, and Flushing High School.
Ownership History
Date
Name
Owned For
Owner Type
Purchase Details
Closed on
Nov 10, 2008
Sold by
Fabian Juana A
Bought by
Fabian Brian C and Fabian Juana A
Current Estimated Value
Home Financials for this Owner
Home Financials are based on the most recent Mortgage that was taken out on this home.
Original Mortgage
$26,098
Interest Rate
6.03%
Mortgage Type
Purchase Money Mortgage
Purchase Details
Closed on
Jun 24, 2003
Sold by
Fabian Juana A and Fabian Ramon
Bought by
Fabian Juana A
Home Financials for this Owner
Home Financials are based on the most recent Mortgage that was taken out on this home.
Original Mortgage
$292,500
Interest Rate
6.31%
Mortgage Type
Purchase Money Mortgage
Purchase Details
Closed on
Feb 28, 2002
Sold by
Taitt Dennis
Bought by
Fabian Ramon and Fabian Juana A
Home Financials for this Owner
Home Financials are based on the most recent Mortgage that was taken out on this home.
Original Mortgage
$274,811
Interest Rate
7%
Mortgage Type
Purchase Money Mortgage
Create a Home Valuation Report for This Property
The Home Valuation Report is an in-depth analysis detailing your home's value as well as a comparison with similar homes in the area
Home Values in the Area
Average Home Value in this Area
Purchase History
| Date | Buyer | Sale Price | Title Company |
|---|---|---|---|
| Fabian Brian C | -- | -- | |
| Fabian Brian C | -- | -- | |
| Fabian Juana A | -- | -- | |
| Fabian Juana A | -- | -- | |
| Fabian Ramon | -- | -- | |
| Fabian Ramon | -- | -- |
Source: Public Records
Mortgage History
| Date | Status | Borrower | Loan Amount |
|---|---|---|---|
| Previous Owner | Fabian Brian C | $26,098 | |
| Previous Owner | Fabian Juana A | $292,500 | |
| Previous Owner | Fabian Ramon | $274,811 |
Source: Public Records
Tax History
| Year | Tax Paid | Tax Assessment Tax Assessment Total Assessment is a certain percentage of the fair market value that is determined by local assessors to be the total taxable value of land and additions on the property. | Land | Improvement |
|---|---|---|---|---|
| 2025 | $5,181 | $27,337 | $8,936 | $18,401 |
| 2024 | $5,181 | $25,795 | $7,923 | $17,872 |
| 2023 | $5,138 | $25,579 | $6,634 | $18,945 |
| 2022 | $4,904 | $54,600 | $16,200 | $38,400 |
| 2021 | $4,821 | $45,240 | $16,200 | $29,040 |
| 2020 | $4,822 | $40,860 | $16,200 | $24,660 |
| 2019 | $4,497 | $45,000 | $16,200 | $28,800 |
| 2018 | $4,345 | $21,316 | $7,533 | $13,783 |
| 2017 | $4,102 | $20,124 | $7,372 | $12,752 |
| 2016 | $3,796 | $20,124 | $7,372 | $12,752 |
| 2015 | $2,070 | $18,984 | $12,055 | $6,929 |
| 2014 | $2,070 | $17,914 | $9,660 | $8,254 |
Source: Public Records
Map
Nearby Homes
- 112-25 34th Ave Unit 2D
- 112-25 34th Ave Unit H
- 11219 34th Ave Unit F
- 11225 34th Ave Unit G
- 11224 Northern Blvd Unit 3G
- 11224 Northern Blvd Unit 5D
- 113-15 34 Ave Unit 5C
- 112-02 Northern Blvd Unit 2B
- 112-02 Northern Blvd Unit 6
- 112-02 Northern Blvd Unit Phc
- 11202 Northern Blvd Unit 6C
- 112-30 Northern Blvd Unit 4B
- 112-30 Northern Blvd Unit 2A
- 112-50 Northern Blvd Unit 3B
- 112-50 Northern Blvd Unit 1A
- 110-10 34th Ave
- 34-37 110th St
- 101-12 Northern Blvd
- 109-16 34th Ave
- 34-49 110th St
- 3321 112th St Unit 2
- 33-21 112th St Unit 2
- 3323 112th St
- 3319 112th St
- 3323 112th St
- 33-23 112th St
- 3317 112th St
- 3315 112th St
- 3311 112th St
- 112-19 34th Ave Unit 1c
- 112-19 34th Ave Unit F
- 3330 112th St
- 33-22 112th St
- 3328 112th St
- 3332 112th St
- 3324 112th St
- 112-02 Northern Blvd Unit 3F
- 112-02 Northern Blvd Unit 6th
- 112-02 Northern Blvd Unit Ph 6
- 112-02 Northern Blvd Unit 3A
Your Personal Tour Guide
Ask me questions while you tour the home.