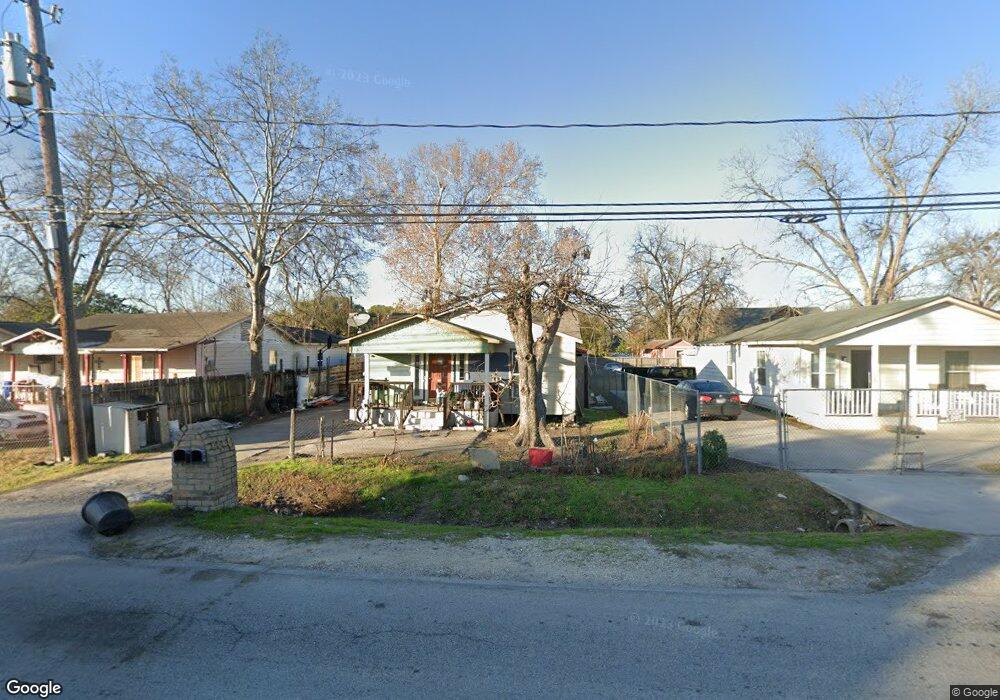
3321 Bertrand St Houston, TX 77093
East Aldine NeighborhoodEstimated Value: $151,000 - $227,000
4
Beds
2
Baths
1,950
Sq Ft
$104/Sq Ft
Est. Value
About This Home
This home is located at 3321 Bertrand St, Houston, TX 77093 and is currently estimated at $203,106, approximately $104 per square foot. 3321 Bertrand St is a home located in Harris County with nearby schools including Vardeman EC/PK/K, Worsham Elementary School, and Macarthur Ninth Grade School.
Ownership History
Date
Name
Owned For
Owner Type
Purchase Details
Closed on
Mar 26, 2004
Sold by
Villasana Rosalinda
Bought by
Villasana Luis F and Villasana Fernando
Current Estimated Value
Home Financials for this Owner
Home Financials are based on the most recent Mortgage that was taken out on this home.
Original Mortgage
$56,000
Outstanding Balance
$32,167
Interest Rate
8.95%
Mortgage Type
New Conventional
Estimated Equity
$170,939
Purchase Details
Closed on
Apr 24, 2000
Sold by
Alamilla Francisco A and Alamilla Elsy
Bought by
Villasana Rosalinda
Home Financials for this Owner
Home Financials are based on the most recent Mortgage that was taken out on this home.
Original Mortgage
$35,625
Interest Rate
8.21%
Purchase Details
Closed on
Nov 16, 1999
Sold by
Klawinski Thomas A
Bought by
Alamilla Francisco A and Alamilla Elsy
Create a Home Valuation Report for This Property
The Home Valuation Report is an in-depth analysis detailing your home's value as well as a comparison with similar homes in the area
Home Values in the Area
Average Home Value in this Area
Purchase History
| Date | Buyer | Sale Price | Title Company |
|---|---|---|---|
| Villasana Luis F | -- | Fidelity National Title Co | |
| Villasana Rosalinda | -- | Commonwealth Land Title | |
| Alamilla Francisco A | -- | Texas American Title Company |
Source: Public Records
Mortgage History
| Date | Status | Borrower | Loan Amount |
|---|---|---|---|
| Open | Villasana Luis F | $56,000 | |
| Closed | Villasana Rosalinda | $35,625 | |
| Closed | Villasana Rosalinda | $9,500 |
Source: Public Records
Tax History Compared to Growth
Tax History
| Year | Tax Paid | Tax Assessment Tax Assessment Total Assessment is a certain percentage of the fair market value that is determined by local assessors to be the total taxable value of land and additions on the property. | Land | Improvement |
|---|---|---|---|---|
| 2025 | $657 | $188,618 | $31,500 | $157,118 |
| 2024 | $657 | $148,074 | $31,500 | $116,574 |
| 2023 | $657 | $148,074 | $31,500 | $116,574 |
| 2022 | $1,449 | $123,564 | $31,500 | $92,064 |
| 2021 | $1,381 | $74,438 | $31,500 | $42,938 |
| 2020 | $1,323 | $74,438 | $31,500 | $42,938 |
| 2019 | $1,259 | $74,438 | $31,500 | $42,938 |
| 2018 | $332 | $48,123 | $14,700 | $33,423 |
| 2017 | $1,091 | $48,123 | $14,700 | $33,423 |
| 2016 | $1,091 | $48,123 | $14,700 | $33,423 |
| 2015 | $814 | $48,123 | $14,700 | $33,423 |
| 2014 | $814 | $48,123 | $14,700 | $33,423 |
Source: Public Records
Map
Nearby Homes
- 3111 Hartwick Rd
- 4007 Wedgewood St
- 3214 Brea Crest St
- 11769 Gloger St
- 2915 Brea Crest St
- 4415 Mooney Rd
- 2723 Castledale Dr
- 3418 Hopper Rd
- 9213 Washington St
- 4522 Collins Rd
- 2817 Cromwell St
- 3804 Cedar Hill Ln
- 11716 Innsbury Dr
- 2410 Mierianne St
- 11937 Connor St
- 11206 Eastex Fwy
- 11746 Somerset Ln
- 4410 Shelton Rd
- 2629 Kowis St
- 2326 Sunny Dr
- 3325 Bertrand St
- 3317 Bertrand St
- 3329 Bertrand St
- 3313 Bertrand St
- 3333 Bertrand St
- 3322 Mierianne St
- 3326 Mierianne St
- 3318 Mierianne St
- 3309 Bertrand St
- 3330 Mierianne St
- 3314 Mierianne St
- 3318 Bertrand St
- 3326 Bertrand St
- 3334 Mierianne St
- 3334 Mierianne St
- 3334 Mierianne St Unit 1
- 3334 Mierianne St Unit 2
- 3334 Mierianne St Unit 3
- 3334 Mierianne St Unit 4
- 3314 Bertrand St