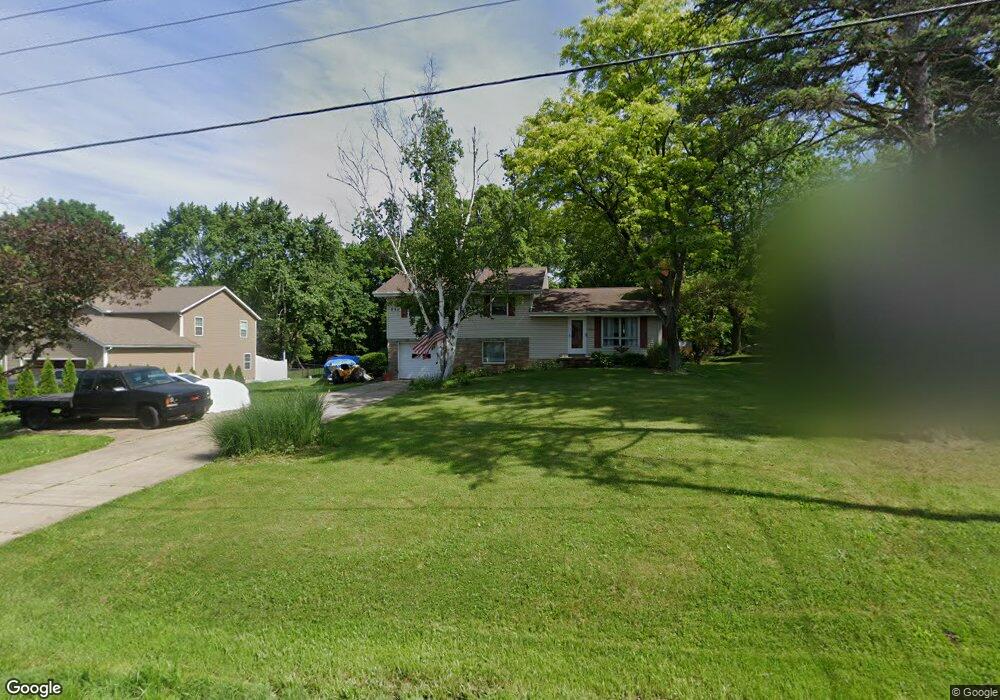
3321 Brenner Rd Barberton, OH 44203
Estimated Value: $242,000 - $342,000
4
Beds
3
Baths
1,424
Sq Ft
$211/Sq Ft
Est. Value
About This Home
This home is located at 3321 Brenner Rd, Barberton, OH 44203 and is currently estimated at $300,547, approximately $211 per square foot. 3321 Brenner Rd is a home located in Summit County with nearby schools including Copley-Fairlawn Middle School, Copley High School, and Spring Garden Waldorf School.
Ownership History
Date
Name
Owned For
Owner Type
Purchase Details
Closed on
Aug 8, 2025
Sold by
Parker James F and Parker Lisa A
Bought by
Parker James Frederick
Current Estimated Value
Home Financials for this Owner
Home Financials are based on the most recent Mortgage that was taken out on this home.
Original Mortgage
$153,864
Outstanding Balance
$153,732
Interest Rate
6.77%
Mortgage Type
FHA
Estimated Equity
$146,815
Purchase Details
Closed on
Mar 28, 2012
Sold by
Miracle Michael W
Bought by
Parker James F and Parker Lisa A
Home Financials for this Owner
Home Financials are based on the most recent Mortgage that was taken out on this home.
Original Mortgage
$78,982
Interest Rate
3.75%
Mortgage Type
FHA
Purchase Details
Closed on
Feb 18, 1999
Sold by
Miracle Carl R and Miracle Edna R
Bought by
Miracle Carl R and Miracle Edna R
Create a Home Valuation Report for This Property
The Home Valuation Report is an in-depth analysis detailing your home's value as well as a comparison with similar homes in the area
Home Values in the Area
Average Home Value in this Area
Purchase History
| Date | Buyer | Sale Price | Title Company |
|---|---|---|---|
| Parker James Frederick | -- | Kingdom Title | |
| Parker James F | $92,000 | Ohio Fidelity Title Agency | |
| Miracle Carl R | -- | -- |
Source: Public Records
Mortgage History
| Date | Status | Borrower | Loan Amount |
|---|---|---|---|
| Open | Parker James Frederick | $153,864 | |
| Previous Owner | Parker James F | $78,982 |
Source: Public Records
Tax History
| Year | Tax Paid | Tax Assessment Tax Assessment Total Assessment is a certain percentage of the fair market value that is determined by local assessors to be the total taxable value of land and additions on the property. | Land | Improvement |
|---|---|---|---|---|
| 2025 | $3,616 | $68,373 | $10,206 | $58,167 |
| 2024 | $3,616 | $68,373 | $10,206 | $58,167 |
| 2023 | $3,616 | $68,373 | $10,206 | $58,167 |
| 2022 | $4,087 | $63,308 | $9,450 | $53,858 |
| 2021 | $3,770 | $63,308 | $9,450 | $53,858 |
| 2020 | $3,680 | $63,310 | $9,450 | $53,860 |
| 2019 | $3,835 | $59,500 | $9,450 | $50,050 |
| 2018 | $3,683 | $59,500 | $9,450 | $50,050 |
| 2017 | $3,201 | $59,500 | $9,450 | $50,050 |
| 2016 | $3,159 | $49,570 | $9,450 | $40,120 |
| 2015 | $3,201 | $49,570 | $9,450 | $40,120 |
| 2014 | $3,141 | $49,570 | $9,450 | $40,120 |
| 2013 | $3,225 | $51,630 | $9,450 | $42,180 |
Source: Public Records
Map
Nearby Homes
- 3246 Stimson Rd
- 2958 Moyer Ave
- 2430 S Hametown Rd
- 3212 Longwood Dr
- 2938 S Hametown Rd
- 3320 Butternut Dr
- 2427 Wadsworth Rd
- 2973 Colon Dr
- 2950 Colon Dr
- 3730 S Sunnyfield Dr
- 1638 S Cleveland Massillon Rd
- 1605 Centerview Dr
- 1569 Denise Dr
- 2992 Greenridge Rd
- 1548 Sunside Dr
- 2660 S Medina Line Rd
- 2910 S/L 17 Willow Way
- 2943 S/L 5 Willow Way
- 2891 S/L 10 Willow Way
- 0 Reimer Rd Unit 3968822
- 3311 Brenner Rd
- 3331 Brenner Rd
- 3341 Brenner Rd
- 3322 Brenner Rd
- 3291 Brenner Rd
- 3312 Brenner Rd
- 3332 Brenner Rd
- 3351 Brenner Rd
- 3302 Brenner Rd
- 3342 Brenner Rd
- 3292 Brenner Rd
- 3281 Brenner Rd
- 3352 Brenner Rd
- 3361 Brenner Rd
- 3282 Brenner Rd
- 3362 Brenner Rd
- 3301 Boyne Rd
- 3291 Boyne Rd
- 3311 Boyne Rd
- 3281 Boyne Rd
Your Personal Tour Guide
Ask me questions while you tour the home.