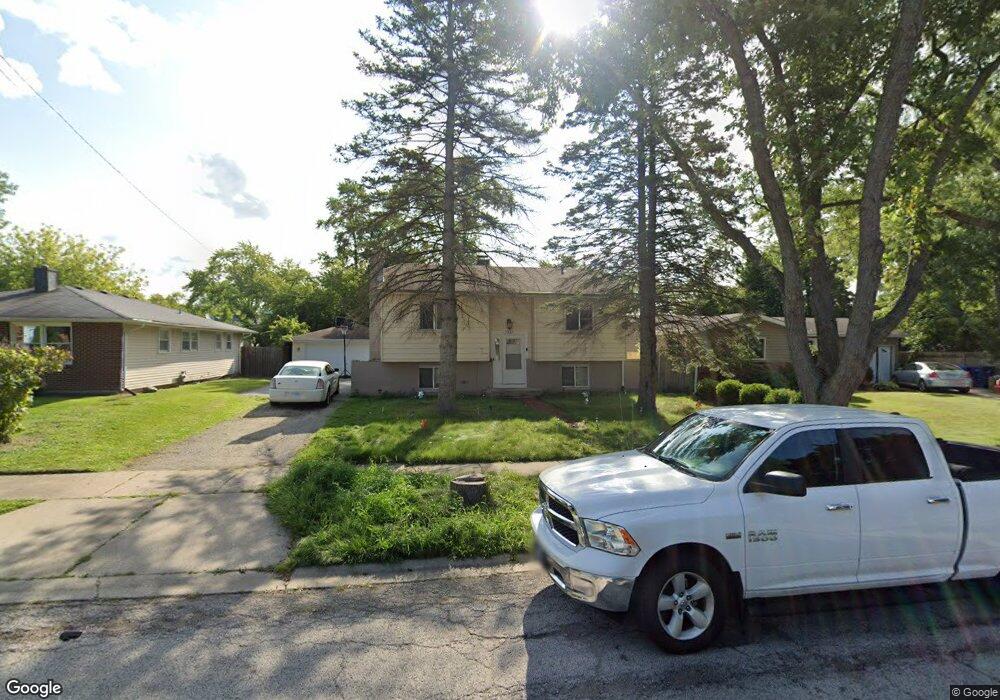
3321 Chatham Rd Waukegan, IL 60087
Estimated Value: $245,000 - $262,000
4
Beds
2
Baths
756
Sq Ft
$333/Sq Ft
Est. Value
About This Home
This home is located at 3321 Chatham Rd, Waukegan, IL 60087 and is currently estimated at $251,510, approximately $332 per square foot. 3321 Chatham Rd is a home located in Lake County with nearby schools including H R McCall Elementary School, Jack Benny Middle School, and Waukegan High School.
Ownership History
Date
Name
Owned For
Owner Type
Purchase Details
Closed on
Aug 23, 2018
Sold by
Nast Lauren and Nasr Andrew
Bought by
Nast Andrew and Nast Lauren
Current Estimated Value
Purchase Details
Closed on
Dec 10, 2010
Sold by
Brosio Lauren
Bought by
Brosio Lauren and Nast Andrew
Purchase Details
Closed on
Jun 21, 2010
Sold by
Donnellan Builders Inc
Bought by
Brosio Lauren
Home Financials for this Owner
Home Financials are based on the most recent Mortgage that was taken out on this home.
Original Mortgage
$133,206
Outstanding Balance
$90,492
Interest Rate
5.25%
Mortgage Type
FHA
Estimated Equity
$161,018
Purchase Details
Closed on
Nov 3, 2009
Sold by
Doble Denise and Estate Of Donald D Roderick
Bought by
Donnellan Builders Inc
Create a Home Valuation Report for This Property
The Home Valuation Report is an in-depth analysis detailing your home's value as well as a comparison with similar homes in the area
Home Values in the Area
Average Home Value in this Area
Purchase History
| Date | Buyer | Sale Price | Title Company |
|---|---|---|---|
| Nast Andrew | -- | Chicago Title Insurance Comp | |
| Brosio Lauren | -- | None Available | |
| Brosio Lauren | $135,000 | First American Title Ins Co | |
| Donnellan Builders Inc | $50,000 | Chicago Title Insurance Co |
Source: Public Records
Mortgage History
| Date | Status | Borrower | Loan Amount |
|---|---|---|---|
| Open | Brosio Lauren | $133,206 |
Source: Public Records
Tax History Compared to Growth
Tax History
| Year | Tax Paid | Tax Assessment Tax Assessment Total Assessment is a certain percentage of the fair market value that is determined by local assessors to be the total taxable value of land and additions on the property. | Land | Improvement |
|---|---|---|---|---|
| 2024 | $5,916 | $69,447 | $10,226 | $59,221 |
| 2023 | $5,377 | $62,738 | $9,238 | $53,500 |
| 2022 | $5,377 | $54,997 | $7,921 | $47,076 |
| 2021 | $4,991 | $47,875 | $7,544 | $40,331 |
| 2020 | $5,284 | $46,618 | $7,028 | $39,590 |
| 2019 | $5,318 | $42,718 | $6,440 | $36,278 |
| 2018 | $4,645 | $35,924 | $8,287 | $27,637 |
| 2017 | $4,521 | $31,783 | $7,332 | $24,451 |
| 2016 | $4,268 | $27,618 | $6,371 | $21,247 |
| 2015 | $4,175 | $24,718 | $5,702 | $19,016 |
| 2014 | $5,329 | $31,498 | $6,135 | $25,363 |
| 2012 | $6,604 | $34,125 | $6,646 | $27,479 |
Source: Public Records
Map
Nearby Homes
- 3211 Rugby Ct
- 3101 Country Club Ln
- 3411 N Lewis Ave
- 37966 N Cornell Rd
- 2625 Vercoe Ave
- 1730 W Beach Rd
- 12582 W Beach Rd
- 1636 Rice St
- 38683 N Lewis Ave
- 12312 W Audrey Ave
- 1612 Whitney St
- 38127 N Shore Ave
- 2613 N Lewis Ave
- 38362 N Manor Ave
- 38859 N Green Bay Rd
- 2708 Dana Ave
- 37905 N Loyola Ave
- 11345 W Carnahan Ave
- 2705 Dana Ave
- 38697 N Cedar Ave
- 3325 Chatham Rd
- 3317 Chatham Rd
- 3329 Chatham Rd
- 3313 Chatham Rd
- 3322 Winhaven Dr
- 3318 Winhaven Dr
- 3326 Winhaven Dr
- 3330 Winhaven Dr
- 3314 Winhaven Dr
- 3320 Chatham Rd
- 3333 Chatham Rd
- 3316 Chatham Rd
- 3324 Chatham Rd
- 3305 Chatham Rd
- 3328 Chatham Rd
- 2428 Dover Rd
- 3312 Chatham Rd
- 3334 Winhaven Dr
- 2424 Dover Rd
- 2415 Edgewood Rd