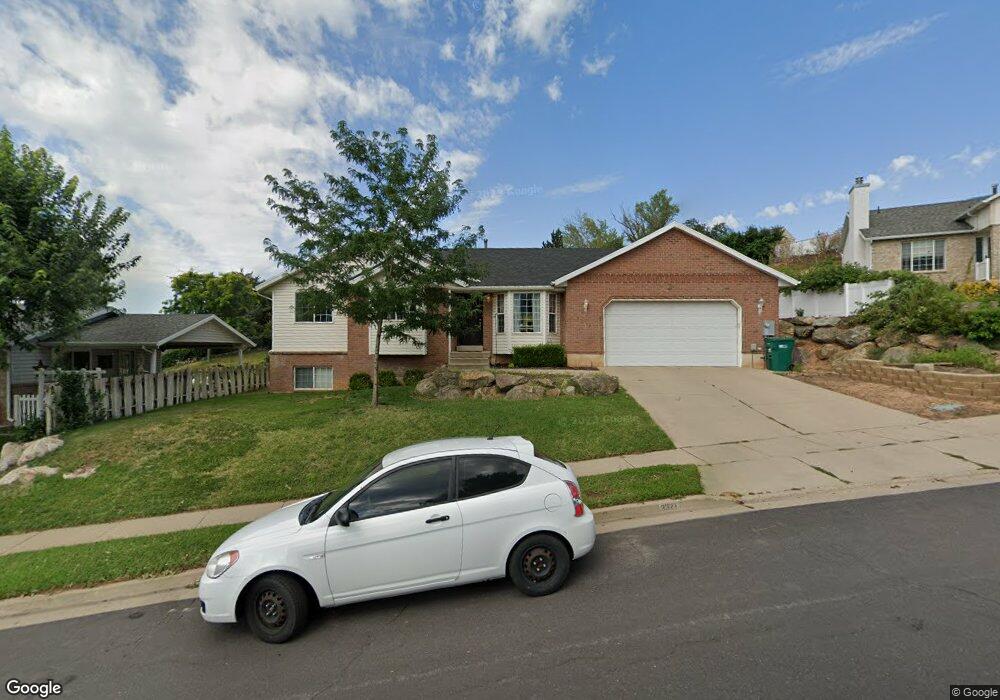
3321 N 1050 E Layton, UT 84040
Estimated Value: $486,000 - $522,000
5
Beds
3
Baths
2,346
Sq Ft
$215/Sq Ft
Est. Value
About This Home
This home is located at 3321 N 1050 E, Layton, UT 84040 and is currently estimated at $504,005, approximately $214 per square foot. 3321 N 1050 E is a home located in Davis County with nearby schools including Mountain View Elementary School, North Layton Junior High School, and Northridge High School.
Ownership History
Date
Name
Owned For
Owner Type
Purchase Details
Closed on
Nov 17, 2016
Sold by
Gover Thom Marcus
Bought by
Gover Thom Marcus and Gover Stefanie Lyn
Current Estimated Value
Purchase Details
Closed on
Feb 25, 2013
Sold by
Brown Cameron and Brown Jaclyn S
Bought by
Myers Christopher D and Myers Lindsey K
Home Financials for this Owner
Home Financials are based on the most recent Mortgage that was taken out on this home.
Original Mortgage
$182,238
Interest Rate
3.25%
Mortgage Type
FHA
Purchase Details
Closed on
May 14, 2010
Sold by
Draper Shawn
Bought by
Brown Cameron and Brown Jaclyn S
Home Financials for this Owner
Home Financials are based on the most recent Mortgage that was taken out on this home.
Original Mortgage
$6,297
Interest Rate
5.03%
Mortgage Type
Stand Alone Second
Purchase Details
Closed on
Jan 13, 2003
Sold by
Clark George and Clark Bonnie
Bought by
Draper Shawn
Home Financials for this Owner
Home Financials are based on the most recent Mortgage that was taken out on this home.
Original Mortgage
$152,752
Interest Rate
6.06%
Mortgage Type
FHA
Purchase Details
Closed on
Apr 30, 2002
Sold by
Olsen Layne R and Olsen Janis G
Bought by
Clark George and Clark Bonnie
Create a Home Valuation Report for This Property
The Home Valuation Report is an in-depth analysis detailing your home's value as well as a comparison with similar homes in the area
Home Values in the Area
Average Home Value in this Area
Purchase History
| Date | Buyer | Sale Price | Title Company |
|---|---|---|---|
| Gover Thom Marcus | -- | Old Republic Title | |
| Gover Thom Marcus | -- | First American Title | |
| Myers Christopher D | -- | None Available | |
| Brown Cameron | -- | First American Title | |
| Draper Shawn | -- | Inwest Title Services Inc | |
| Clark George | $113,000 | -- |
Source: Public Records
Mortgage History
| Date | Status | Borrower | Loan Amount |
|---|---|---|---|
| Previous Owner | Myers Christopher D | $182,238 | |
| Previous Owner | Brown Cameron | $6,297 | |
| Previous Owner | Brown Cameron | $177,509 | |
| Previous Owner | Draper Shawn | $152,752 |
Source: Public Records
Tax History
| Year | Tax Paid | Tax Assessment Tax Assessment Total Assessment is a certain percentage of the fair market value that is determined by local assessors to be the total taxable value of land and additions on the property. | Land | Improvement |
|---|---|---|---|---|
| 2025 | $2,384 | $250,250 | $116,404 | $133,846 |
| 2024 | $2,257 | $238,700 | $86,787 | $151,913 |
| 2023 | $2,248 | $419,000 | $150,496 | $268,504 |
| 2022 | $2,364 | $239,250 | $79,929 | $159,321 |
| 2021 | $2,193 | $331,000 | $129,228 | $201,772 |
| 2020 | $1,982 | $287,000 | $98,442 | $188,558 |
| 2019 | $1,953 | $277,000 | $81,932 | $195,068 |
| 2018 | $1,763 | $251,000 | $77,294 | $173,706 |
| 2016 | $1,566 | $115,005 | $36,263 | $78,742 |
| 2015 | $1,452 | $101,255 | $36,263 | $64,992 |
| 2014 | $1,490 | $106,246 | $36,263 | $69,983 |
| 2013 | -- | $97,521 | $28,952 | $68,569 |
Source: Public Records
Map
Nearby Homes
- 3306 N Fairfield Rd
- 935 E 3000 N Unit 175
- 935 E 3000 N Unit 165
- 935 E 3000 N Unit 26
- 935 E 3000 N Unit 90
- 935 E 3000 N Unit 27
- 935 E Highway 193 Unit 102
- 935 E 3000 N Unit 56
- 1266 E 3125 N
- 1505 E 3225 N
- 948 E Hercules Ct Unit 179
- 2798 N 1525 E
- 1447 E 2700 N
- 1292 E 2675 N
- 2529 N 1000 E
- 1123 E 2500 N
- 1827 E Whitetail Dr
- 1821 E Whitetail Way
- 414 E 2625 N
- 1731 E 2825 N