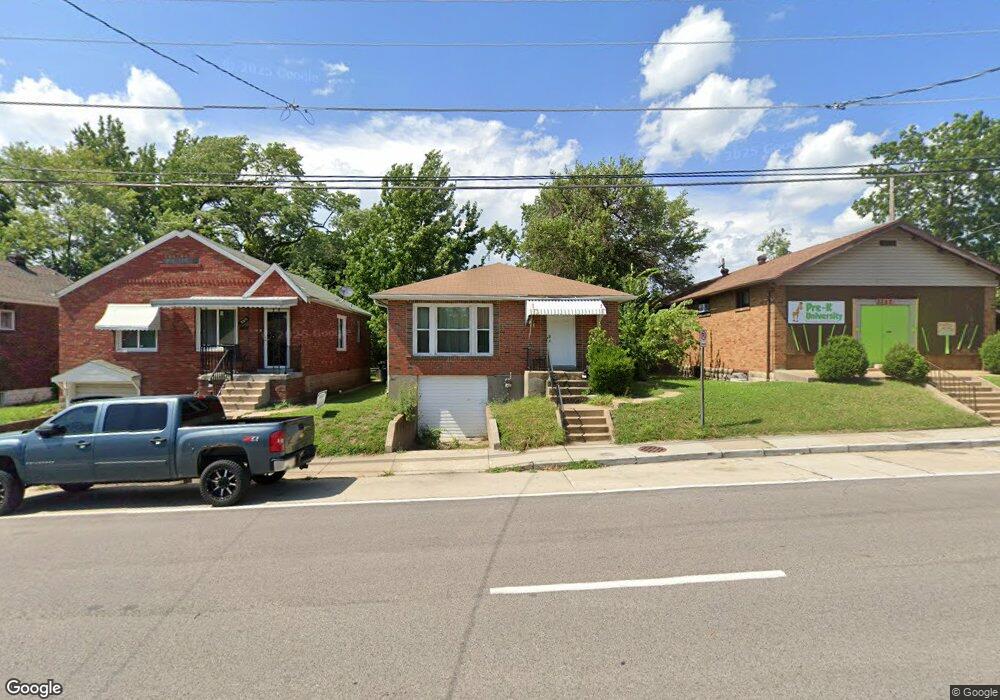
3321 N Hanley Rd Saint Louis, MO 63121
Estimated Value: $66,000 - $75,000
1
Bed
1
Bath
780
Sq Ft
$89/Sq Ft
Est. Value
About This Home
This home is located at 3321 N Hanley Rd, Saint Louis, MO 63121 and is currently estimated at $69,668, approximately $89 per square foot. 3321 N Hanley Rd is a home located in St. Louis County with nearby schools including Normandy High School, St. Ann Catholic School, and Our Lady Of Guadalupe School.
Ownership History
Date
Name
Owned For
Owner Type
Purchase Details
Closed on
Feb 21, 2012
Sold by
The Bank Of New York Mellon
Bought by
Neosho Realty Llc
Current Estimated Value
Purchase Details
Closed on
Jan 5, 2012
Sold by
Brown Paul and Brown Janis
Bought by
The Bank Of New York Mellon and The Bank Of New York
Purchase Details
Closed on
Nov 8, 2005
Sold by
Greeves Clifford
Bought by
Brown Paul and Brown Janis
Home Financials for this Owner
Home Financials are based on the most recent Mortgage that was taken out on this home.
Original Mortgage
$54,800
Interest Rate
11.3%
Mortgage Type
Stand Alone First
Purchase Details
Closed on
Jul 9, 2004
Sold by
A V I S Sewer Services Inc
Bought by
Greeves Clifford and Clifford Greeves Revocable Living Trust
Home Financials for this Owner
Home Financials are based on the most recent Mortgage that was taken out on this home.
Original Mortgage
$22,500
Interest Rate
6.26%
Mortgage Type
Purchase Money Mortgage
Create a Home Valuation Report for This Property
The Home Valuation Report is an in-depth analysis detailing your home's value as well as a comparison with similar homes in the area
Home Values in the Area
Average Home Value in this Area
Purchase History
| Date | Buyer | Sale Price | Title Company |
|---|---|---|---|
| Neosho Realty Llc | $12,000 | Mokan Title Services Llc | |
| The Bank Of New York Mellon | $16,020 | None Available | |
| Brown Paul | $68,500 | Abstract | |
| Greeves Clifford | $22,500 | -- |
Source: Public Records
Mortgage History
| Date | Status | Borrower | Loan Amount |
|---|---|---|---|
| Previous Owner | Brown Paul | $54,800 | |
| Previous Owner | Greeves Clifford | $22,500 |
Source: Public Records
Tax History Compared to Growth
Tax History
| Year | Tax Paid | Tax Assessment Tax Assessment Total Assessment is a certain percentage of the fair market value that is determined by local assessors to be the total taxable value of land and additions on the property. | Land | Improvement |
|---|---|---|---|---|
| 2025 | $1,098 | $15,490 | $1,980 | $13,510 |
| 2024 | $1,098 | $11,400 | $2,300 | $9,100 |
| 2023 | $1,252 | $12,830 | $2,300 | $10,530 |
| 2022 | $957 | $8,420 | $1,310 | $7,110 |
| 2021 | $929 | $8,420 | $1,310 | $7,110 |
| 2020 | $674 | $5,930 | $1,310 | $4,620 |
| 2019 | $648 | $5,930 | $1,310 | $4,620 |
| 2018 | $428 | $3,520 | $990 | $2,530 |
| 2017 | $423 | $3,520 | $990 | $2,530 |
| 2016 | $444 | $3,510 | $1,310 | $2,200 |
| 2015 | $632 | $5,190 | $1,310 | $3,880 |
| 2014 | $660 | $5,190 | $990 | $4,200 |
Source: Public Records
Map
Nearby Homes
- 3207 Elsworth Place
- 3213 Werder Dr
- 8601 Wales Rd
- 3113 N Hanley Rd
- 8513 Roanoke Dr
- 2937 N Hanley Rd
- 2920 N Hanley Rd
- 8705 Kendale Dr
- 7619 Chorman Ave
- 8836 Ramona Ave
- 3818 N Hanley Rd
- 8328 Ardsley Dr
- 2823 Darwin Ct
- 8245 Glen Echo Dr
- 7707 Horatio Dr
- 8550 Jenny Dr
- 8922 Higginson Dr
- 2816 Lyndhurst Ave
- 2831 Old Hanley Rd
- 2820 Old Hanley Rd
- 3327 N Hanley Rd
- 3315 N Hanley Rd
- 3309 N Hanley Rd
- 3209 Elsworth Place
- 3331 N Hanley Rd
- 3307 N Hanley Rd
- 3208 Maybelle Dr
- 3333 N Hanley Rd
- 3211 Elsworth Place
- 3200 Maybelle Dr
- 3212 Maybelle Dr
- 3208 Elsworth Place
- 3335 N Hanley Rd
- 3214 Maybelle Dr
- 3316 N Hanley Rd
- 3328 N Hanley Rd
- 3210 Elsworth Place
- 3310 N Hanley Rd
- 3212 Elsworth Place