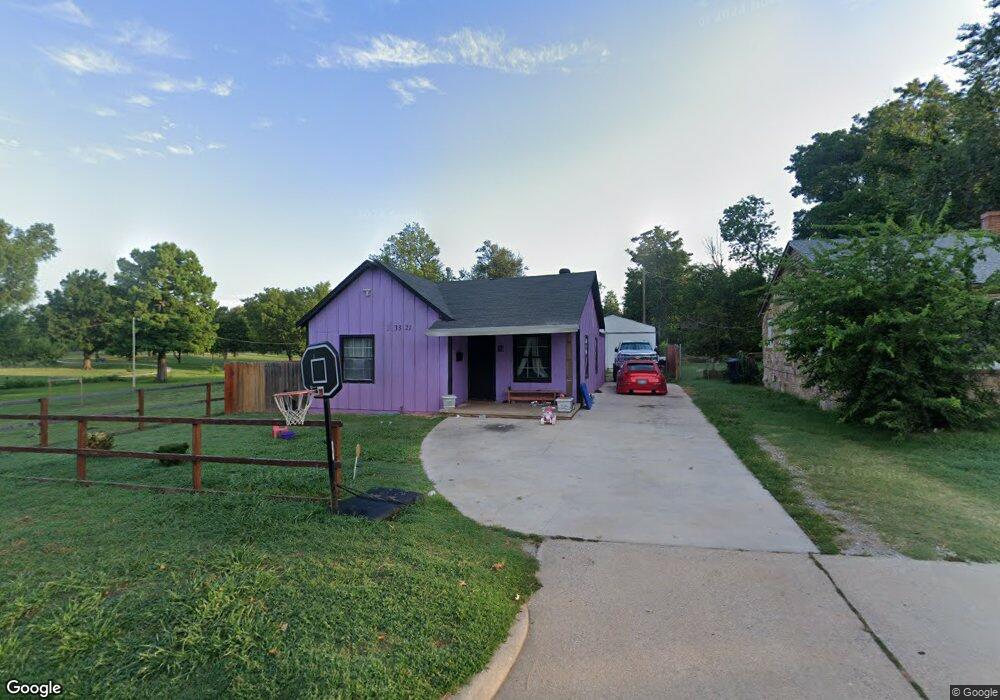
3321 NW 13th St Oklahoma City, OK 73107
Linwood Place NeighborhoodEstimated Value: $106,000 - $123,000
2
Beds
1
Bath
746
Sq Ft
$154/Sq Ft
Est. Value
About This Home
This home is located at 3321 NW 13th St, Oklahoma City, OK 73107 and is currently estimated at $115,168, approximately $154 per square foot. 3321 NW 13th St is a home located in Oklahoma County with nearby schools including Hawthorne Elementary School, Taft Middle School, and Northwest Classen High School.
Ownership History
Date
Name
Owned For
Owner Type
Purchase Details
Closed on
Apr 23, 2020
Sold by
Tran Cindy and Lam Don
Bought by
Global Designs And Construction Llc
Current Estimated Value
Home Financials for this Owner
Home Financials are based on the most recent Mortgage that was taken out on this home.
Original Mortgage
$42,946
Outstanding Balance
$33,951
Interest Rate
3.3%
Mortgage Type
Future Advance Clause Open End Mortgage
Estimated Equity
$81,217
Purchase Details
Closed on
Aug 5, 2009
Sold by
Williams John and Estate Of Darrell Williams
Bought by
Tran Cindy
Purchase Details
Closed on
Jan 10, 2002
Sold by
Williams Elisa Kaye
Bought by
Williams Darrell W
Purchase Details
Closed on
Jun 6, 2001
Sold by
Capps Frank Alvin
Bought by
Capps Vicki Ann
Purchase Details
Closed on
Feb 24, 1999
Sold by
Capps Frank A and Capps Vicki A
Bought by
Williams Darrell W and Williams Elisa K
Create a Home Valuation Report for This Property
The Home Valuation Report is an in-depth analysis detailing your home's value as well as a comparison with similar homes in the area
Home Values in the Area
Average Home Value in this Area
Purchase History
| Date | Buyer | Sale Price | Title Company |
|---|---|---|---|
| Global Designs And Construction Llc | $47,000 | Oklahoma City Abstract & Ttl | |
| Tran Cindy | $18,000 | None Available | |
| Williams Darrell W | -- | -- | |
| Capps Vicki Ann | -- | -- | |
| Williams Darrell W | $30,000 | First Amer Title & Trust Co |
Source: Public Records
Mortgage History
| Date | Status | Borrower | Loan Amount |
|---|---|---|---|
| Open | Global Designs And Construction Llc | $42,946 |
Source: Public Records
Tax History Compared to Growth
Tax History
| Year | Tax Paid | Tax Assessment Tax Assessment Total Assessment is a certain percentage of the fair market value that is determined by local assessors to be the total taxable value of land and additions on the property. | Land | Improvement |
|---|---|---|---|---|
| 2024 | $841 | $7,194 | $1,165 | $6,029 |
| 2023 | $841 | $6,851 | $1,239 | $5,612 |
| 2022 | $768 | $6,525 | $1,374 | $5,151 |
| 2021 | $732 | $6,215 | $1,621 | $4,594 |
| 2020 | $634 | $5,326 | $1,301 | $4,025 |
| 2019 | $604 | $5,073 | $1,345 | $3,728 |
| 2018 | $548 | $4,832 | $0 | $0 |
| 2017 | $522 | $4,601 | $1,349 | $3,252 |
| 2016 | $497 | $4,382 | $1,299 | $3,083 |
| 2015 | $478 | $4,173 | $1,300 | $2,873 |
| 2014 | -- | $3,974 | $1,304 | $2,670 |
Source: Public Records
Map
Nearby Homes
- 3216 NW 14th St
- 3405 NW 15th St
- 3326 NW 16th St
- 3209 NW 14th St
- 3205 NW 14th St
- 3424 NW 16th St
- 3132 NW 16th St
- 1415 N Drexel Blvd
- 1819 N Woodward Ave
- 1521 N Drexel Blvd
- 3517 NW 16th St
- 3216 NW 19th St
- 3429 NW 19th St
- 2938 NW 14th St
- 3020 W Park Place
- 2939 NW 15th St
- 2934 NW 15th St
- 3345 NW 20th St
- 3437 NW 20th St
- 3232 NW 21st St
- 3317 NW 13th St
- 3313 NW 13th St
- 3320 NW 14th St
- 3316 NW 14th St
- 3312 NW 14th St
- 3320 NW 13th St
- 3318 NW 13th St
- 3324 NW 13th St
- 3308 NW 14th St
- 3314 NW 13th St
- 1405 N Independence Ave
- 1409 N Independence Ave
- 1401 N Independence Ave
- 3300 NW 13th St
- 1415 N Independence Ave
- 3321 NW 14th St
- 1317 N Independence Ave
- 1421 N Independence Ave
- 1313 N Independence Ave
- 3325 NW 12th St