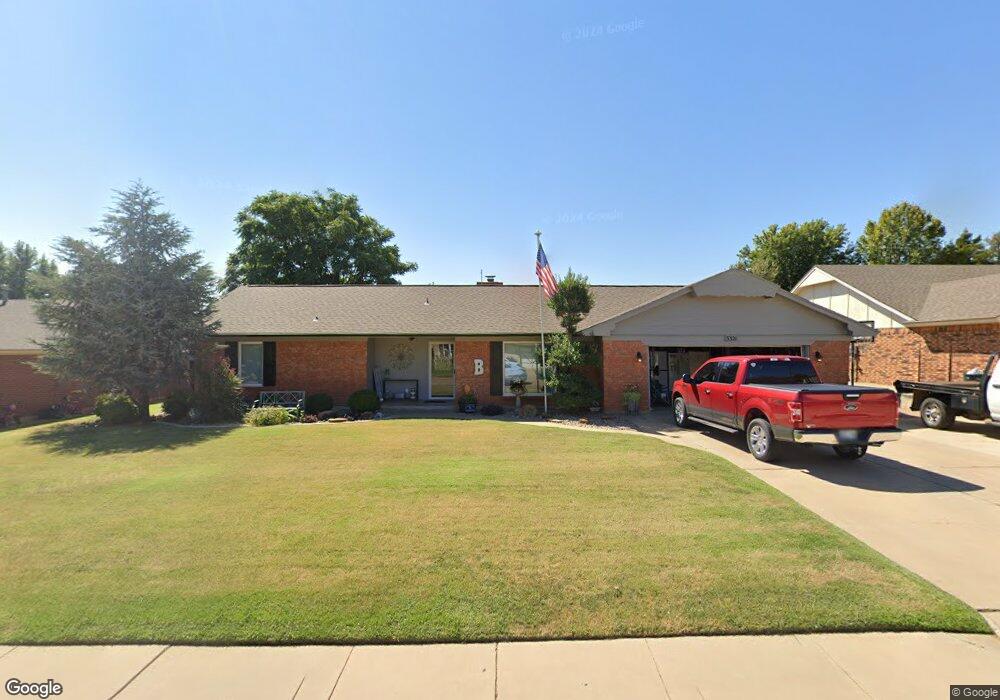
3321 Osage Dr Woodward, OK 73801
Estimated Value: $156,000 - $179,000
3
Beds
2
Baths
1,648
Sq Ft
$104/Sq Ft
Est. Value
About This Home
This home is located at 3321 Osage Dr, Woodward, OK 73801 and is currently estimated at $171,037, approximately $103 per square foot. 3321 Osage Dr is a home located in Woodward County with nearby schools including Woodward High School and Woodward Christian Academy.
Ownership History
Date
Name
Owned For
Owner Type
Purchase Details
Closed on
Feb 26, 2010
Sold by
Glisson Ron and Glisson Judy
Bought by
Boren Joshua C and Boren Anh
Current Estimated Value
Home Financials for this Owner
Home Financials are based on the most recent Mortgage that was taken out on this home.
Original Mortgage
$140,000
Interest Rate
5.05%
Mortgage Type
Unknown
Purchase Details
Closed on
Jun 12, 2009
Sold by
Hensley Timothy P and Hensley Kendra R
Bought by
Glisson Judy
Purchase Details
Closed on
Mar 7, 2005
Sold by
Bell Vanita Marie and Oldham Vanita Bell
Bought by
Oakley Dennis A and Oakley Carolyn J
Home Financials for this Owner
Home Financials are based on the most recent Mortgage that was taken out on this home.
Original Mortgage
$108,000
Interest Rate
5.71%
Mortgage Type
New Conventional
Purchase Details
Closed on
Dec 13, 2002
Bought by
Bell Vanita Marie
Purchase Details
Closed on
Oct 31, 2000
Bought by
Prather Walter and Prather Shirley
Create a Home Valuation Report for This Property
The Home Valuation Report is an in-depth analysis detailing your home's value as well as a comparison with similar homes in the area
Home Values in the Area
Average Home Value in this Area
Purchase History
| Date | Buyer | Sale Price | Title Company |
|---|---|---|---|
| Boren Joshua C | $145,000 | -- | |
| Glisson Judy | -- | -- | |
| Oakley Dennis A | $120,000 | -- | |
| Bell Vanita Marie | $107,000 | -- | |
| Prather Walter | $98,000 | -- |
Source: Public Records
Mortgage History
| Date | Status | Borrower | Loan Amount |
|---|---|---|---|
| Closed | Boren Joshua C | $140,000 | |
| Previous Owner | Oakley Dennis A | $108,000 |
Source: Public Records
Tax History Compared to Growth
Tax History
| Year | Tax Paid | Tax Assessment Tax Assessment Total Assessment is a certain percentage of the fair market value that is determined by local assessors to be the total taxable value of land and additions on the property. | Land | Improvement |
|---|---|---|---|---|
| 2025 | $1,350 | $14,638 | $1,982 | $12,656 |
| 2023 | $1,285 | $14,091 | $1,982 | $12,109 |
| 2022 | $1,264 | $13,606 | $1,982 | $11,624 |
| 2021 | $1,368 | $15,137 | $1,982 | $13,155 |
| 2020 | $1,379 | $15,137 | $1,982 | $13,155 |
| 2019 | $1,456 | $16,308 | $1,982 | $14,326 |
| 2018 | $1,409 | $15,531 | $1,982 | $13,549 |
| 2017 | $1,327 | $14,791 | $1,982 | $12,809 |
| 2016 | $1,451 | $15,950 | $1,076 | $14,874 |
| 2015 | $1,395 | $15,950 | $1,076 | $14,874 |
| 2014 | $1,395 | $15,950 | $1,076 | $14,874 |
Source: Public Records
Map
Nearby Homes
- 3336 Osage Dr
- 617 Comanche Dr
- 3636 Cheyenne Dr
- 2915 Cheyenne Dr
- 2805 Choctaw Ct
- 2627 Madison Ave
- 2700 Main St
- 2623 Kansas Ave
- 2531 Taylor Ave
- 1722 Robin Dr
- 2503 Santa fe St
- 2422 Santa fe St
- 1408 27th St
- 2412 Taylor Ave
- 2324 Webster Ave
- 518 24th St
- 1514 26th St
- 4221 Oklahoma Ave
- 2308 Santa fe St
- 2523 Cherry St
- 3313 Osage Dr
- 3329 Osage Dr
- 3314 Cheyenne Dr
- 3328 Cheyenne Dr
- 3337 Osage Dr
- 3305 Osage Dr
- 3320 Osage Dr
- 3314 Osage Dr
- 3326 Osage Dr
- 3336 Cheyenne Dr
- 3306 Cheyenne Dr
- 3345 Osage Dr
- 3344 Cheyenne Dr
- 3344 Osage Dr
- 3321 Cheyenne Dr
- 3242 Osage Dr
- 3329 Cheyenne Dr
- 3315 Cheyenne Dr
- 3236 Osage Dr
- 3337 Cheyenne Dr