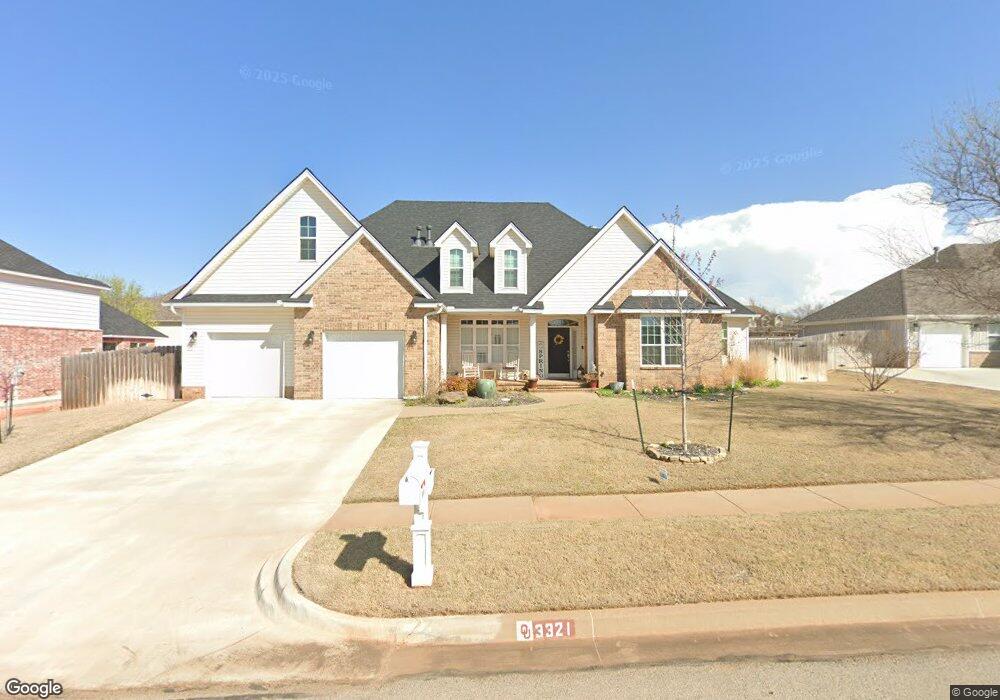
3321 Quidnet Rd Norman, OK 73071
Northeast Norman NeighborhoodEstimated Value: $429,873 - $499,000
3
Beds
3
Baths
2,860
Sq Ft
$164/Sq Ft
Est. Value
About This Home
This home is located at 3321 Quidnet Rd, Norman, OK 73071 and is currently estimated at $468,468, approximately $163 per square foot. 3321 Quidnet Rd is a home located in Cleveland County with nearby schools including Jefferson Elementary School, Longfellow Middle School, and Norman North High School.
Ownership History
Date
Name
Owned For
Owner Type
Purchase Details
Closed on
Oct 28, 2022
Sold by
Bmi Systems Corporation
Bought by
Donahoo Jerrod Michael and Murphy Jennifer
Current Estimated Value
Purchase Details
Closed on
Oct 19, 2007
Sold by
Johnson David Wayne and Johnson Angela Renee
Bought by
Jones Johnny E and Jones Lindy A
Home Financials for this Owner
Home Financials are based on the most recent Mortgage that was taken out on this home.
Original Mortgage
$200,000
Interest Rate
6.47%
Mortgage Type
New Conventional
Purchase Details
Closed on
Dec 6, 2006
Sold by
American Lebanese Syrian Associated Char
Bought by
Johnson David Wayne and Johnson Angela Renee
Home Financials for this Owner
Home Financials are based on the most recent Mortgage that was taken out on this home.
Original Mortgage
$200,000
Interest Rate
6.3%
Mortgage Type
Credit Line Revolving
Purchase Details
Closed on
Oct 5, 2005
Sold by
Applewood Construction Llc
Bought by
American Lebanese Syrian Assn Charities
Create a Home Valuation Report for This Property
The Home Valuation Report is an in-depth analysis detailing your home's value as well as a comparison with similar homes in the area
Home Values in the Area
Average Home Value in this Area
Purchase History
| Date | Buyer | Sale Price | Title Company |
|---|---|---|---|
| Donahoo Jerrod Michael | $65,000 | Chicago Title | |
| Jones Johnny E | $250,000 | None Available | |
| Johnson David Wayne | $409,000 | None Available | |
| American Lebanese Syrian Assn Charities | -- | None Available |
Source: Public Records
Mortgage History
| Date | Status | Borrower | Loan Amount |
|---|---|---|---|
| Previous Owner | Jones Johnny E | $200,000 | |
| Previous Owner | Johnson David Wayne | $200,000 |
Source: Public Records
Tax History Compared to Growth
Tax History
| Year | Tax Paid | Tax Assessment Tax Assessment Total Assessment is a certain percentage of the fair market value that is determined by local assessors to be the total taxable value of land and additions on the property. | Land | Improvement |
|---|---|---|---|---|
| 2024 | $4,500 | $38,575 | $6,074 | $32,501 |
| 2023 | $4,377 | $37,452 | $7,142 | $30,310 |
| 2022 | $4,072 | $36,361 | $6,934 | $29,427 |
| 2021 | $4,164 | $35,302 | $7,800 | $27,502 |
| 2020 | $4,006 | $34,725 | $7,521 | $27,204 |
| 2019 | $3,953 | $33,713 | $7,800 | $25,913 |
| 2018 | $3,833 | $33,714 | $7,800 | $25,914 |
| 2017 | $3,876 | $33,714 | $0 | $0 |
| 2016 | $3,883 | $33,247 | $7,800 | $25,447 |
| 2015 | $3,767 | $33,247 | $7,800 | $25,447 |
| 2014 | $3,804 | $33,247 | $7,800 | $25,447 |
Source: Public Records
Map
Nearby Homes
- 609 Chilmark Dr
- Preston Plan at The Vineyard
- Collin Plan at The Vineyard
- Patrick Plan at The Vineyard
- Lyla Plan at The Vineyard
- Evie Plan at The Vineyard
- Ledger Plan at The Vineyard
- Drew Plan at The Vineyard
- Sutton Plan at The Vineyard
- Dexter Plan at The Vineyard
- Charli Plan at The Vineyard
- Teagan Plan at The Vineyard
- Baker Plan at The Vineyard
- Colt Plan at The Vineyard
- 3441 Montilla Ct
- 417 Basin Way
- 421 Basin Way
- 3100 Woodcrest Creek Dr
- 511 Basin Way
- 539 Elmcrest Dr
- 3416 Nantucket Blvd
- 3317 Quidnet Rd
- 3408 Nantucket Blvd
- 3316 Quidnet Rd
- 3324 Quidnet Rd
- 3313 Quidnet Rd
- 3328 Wauwinet Way
- 3404 Nantucket Blvd
- 3328 Quidnet Rd
- 3312 Quidnet Rd
- 3333 Wauwinet Way
- 3309 Quidnet Rd
- 3329 Wauwinet Way
- 600 Monomoy Ct
- 601 Monomoy Ct
- 3321 Wauwinet Way
- 3400 Nantucket Blvd
- 3337 Wauwinet Way
- 601 Chilmark Dr
- 604 Monomoy Ct