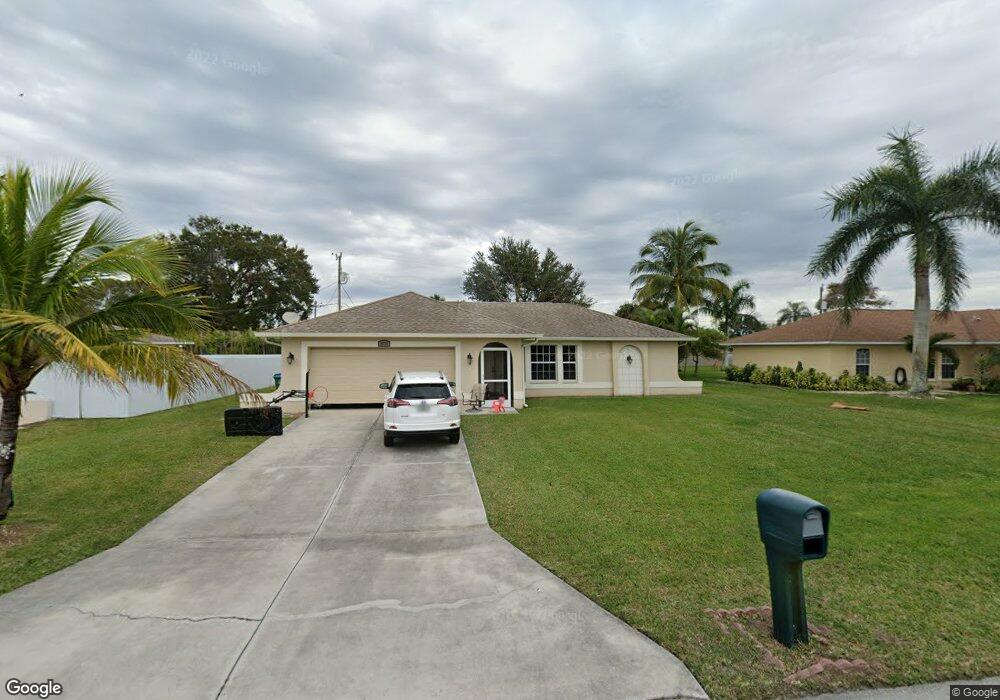
3321 SW 7th Place Unit 45 Cape Coral, FL 33914
Pelican NeighborhoodEstimated Value: $266,000 - $287,000
3
Beds
2
Baths
1,372
Sq Ft
$202/Sq Ft
Est. Value
About This Home
This home is located at 3321 SW 7th Place Unit 45, Cape Coral, FL 33914 and is currently estimated at $277,170, approximately $202 per square foot. 3321 SW 7th Place Unit 45 is a home located in Lee County with nearby schools including Cape Elementary School, Caloosa Elementary School, and Tropic Isles Elementary School.
Ownership History
Date
Name
Owned For
Owner Type
Purchase Details
Closed on
May 28, 2011
Sold by
Walcott Gary and Walcott Virginia
Bought by
Albelo Osniel
Current Estimated Value
Home Financials for this Owner
Home Financials are based on the most recent Mortgage that was taken out on this home.
Original Mortgage
$80,895
Interest Rate
4.25%
Mortgage Type
FHA
Purchase Details
Closed on
May 13, 2005
Sold by
Waterside Custom Homes Of Sw Fl Inc
Bought by
Walcott Gary and Walcott Virginia
Home Financials for this Owner
Home Financials are based on the most recent Mortgage that was taken out on this home.
Original Mortgage
$163,920
Interest Rate
5.25%
Mortgage Type
Unknown
Purchase Details
Closed on
Sep 3, 2003
Sold by
Sams Frank D
Bought by
Waterside Custom Homes Sw Fl Inc
Create a Home Valuation Report for This Property
The Home Valuation Report is an in-depth analysis detailing your home's value as well as a comparison with similar homes in the area
Home Values in the Area
Average Home Value in this Area
Purchase History
| Date | Buyer | Sale Price | Title Company |
|---|---|---|---|
| Albelo Osniel | $83,000 | Fidelity National Title Of F | |
| Walcott Gary | $204,900 | Gulf Breeze Title Insurance | |
| Waterside Custom Homes Sw Fl Inc | $24,500 | -- |
Source: Public Records
Mortgage History
| Date | Status | Borrower | Loan Amount |
|---|---|---|---|
| Previous Owner | Albelo Osniel | $80,895 | |
| Previous Owner | Walcott Gary | $163,920 |
Source: Public Records
Tax History Compared to Growth
Tax History
| Year | Tax Paid | Tax Assessment Tax Assessment Total Assessment is a certain percentage of the fair market value that is determined by local assessors to be the total taxable value of land and additions on the property. | Land | Improvement |
|---|---|---|---|---|
| 2025 | $1,710 | $97,095 | -- | -- |
| 2024 | $1,589 | $94,359 | -- | -- |
| 2023 | $1,589 | $91,611 | $0 | $0 |
| 2022 | $1,414 | $88,943 | $0 | $0 |
| 2021 | $1,352 | $166,788 | $28,000 | $138,788 |
| 2020 | $1,336 | $85,160 | $0 | $0 |
| 2019 | $1,284 | $83,245 | $0 | $0 |
| 2018 | $1,258 | $81,693 | $0 | $0 |
| 2017 | $1,237 | $80,013 | $0 | $0 |
| 2016 | $1,180 | $119,350 | $25,000 | $94,350 |
| 2015 | $1,157 | $108,294 | $15,200 | $93,094 |
| 2014 | $1,093 | $96,894 | $11,800 | $85,094 |
| 2013 | -- | $80,301 | $4,200 | $76,101 |
Source: Public Records
Map
Nearby Homes
- 2932 SW 7th Place
- 3318 SW 8th Place
- 3302 SW 8th Place
- 624 SW 35th St
- 707 SW 35th Terrace
- 625 Gleason Pkwy
- 621 Gleason Pkwy
- 3431 SW 8th Ct
- 3435 SW 8th Ct
- 3508 SW 8th Place Unit 21
- 3404 SW 5th Ave
- 618 SW 31st Terrace
- 3207 SW 5th Place
- 3416 SW 5th Ave
- 802 SW 31st Terrace
- 3432 SW 8th Ct
- 1722 SW 33rd St
- 2805 SW 7th Place
- 1000 SW 32nd Terrace
- 3206 SW 5th Ave
- 3317 SW 7th Place
- 3320 SW 7th Ave
- 3324 SW 7th Ave
- 3316 SW 7th Ave
- 3403 SW 7th Place
- 3313 SW 7th Place
- 716 SW 34th St
- 3318 SW 7th Place
- 3322 SW 7th Place
- 3402 SW 7th Ave
- 3312 SW 7th Ave
- 3407 SW 7th Place
- 3312/3314 SW 7th Place
- 3309 SW 7th Place
- 3406 SW 7th Ave
- 3308 SW 7th Ave
- 3316 SW 7th Place
- 3321 SW 7th Ave Unit 45
- 3308/3310 SW 7th Place
- 3321 Skyline Blvd Unit C