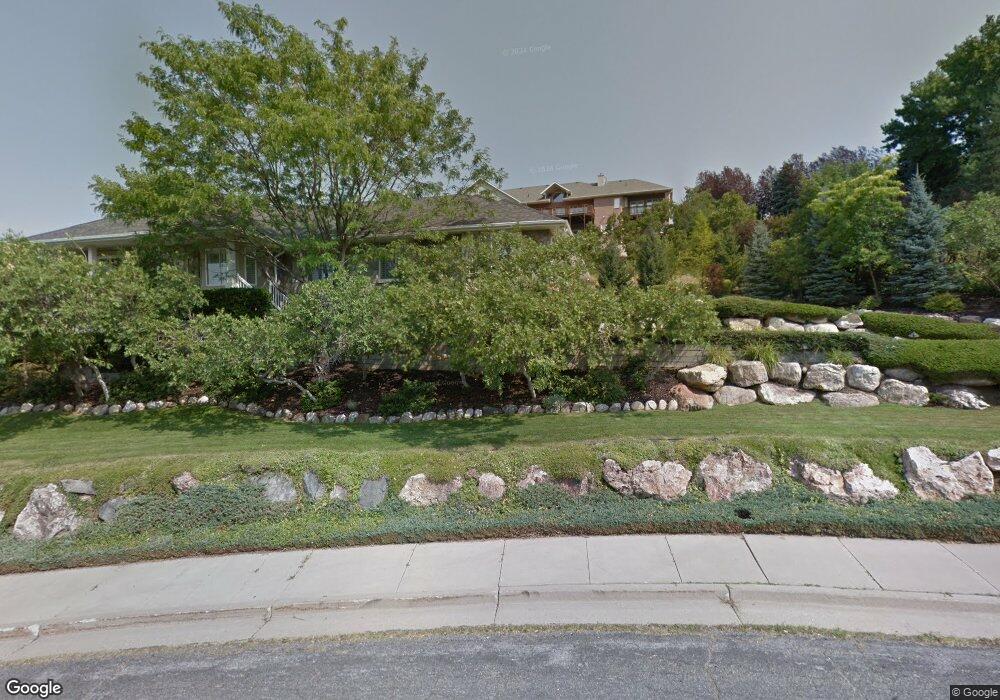
3321 Twin Peaks Dr Layton, UT 84040
Estimated Value: $771,000 - $1,108,157
5
Beds
3
Baths
5,000
Sq Ft
$191/Sq Ft
Est. Value
About This Home
This home is located at 3321 Twin Peaks Dr, Layton, UT 84040 and is currently estimated at $956,789, approximately $191 per square foot. 3321 Twin Peaks Dr is a home located in Davis County with nearby schools including Morgan Elementary School, Fairfield Junior High School, and Layton High School.
Ownership History
Date
Name
Owned For
Owner Type
Purchase Details
Closed on
Oct 18, 2011
Sold by
Young Roger B and Young Corinne
Bought by
Young Roger B and Young Corinne C
Current Estimated Value
Home Financials for this Owner
Home Financials are based on the most recent Mortgage that was taken out on this home.
Original Mortgage
$202,000
Outstanding Balance
$137,439
Interest Rate
4.05%
Mortgage Type
New Conventional
Estimated Equity
$819,350
Purchase Details
Closed on
Dec 11, 1998
Sold by
Ferguson Kim O
Bought by
Young Roger B and Young Corinne
Home Financials for this Owner
Home Financials are based on the most recent Mortgage that was taken out on this home.
Original Mortgage
$227,150
Interest Rate
6.78%
Mortgage Type
Balloon
Create a Home Valuation Report for This Property
The Home Valuation Report is an in-depth analysis detailing your home's value as well as a comparison with similar homes in the area
Home Values in the Area
Average Home Value in this Area
Purchase History
| Date | Buyer | Sale Price | Title Company |
|---|---|---|---|
| Young Roger B | -- | American Preferred | |
| Young Roger B | -- | First American Title Co | |
| Young Roger B | -- | First American Title Co |
Source: Public Records
Mortgage History
| Date | Status | Borrower | Loan Amount |
|---|---|---|---|
| Open | Young Roger B | $202,000 | |
| Closed | Young Roger B | $227,150 |
Source: Public Records
Tax History
| Year | Tax Paid | Tax Assessment Tax Assessment Total Assessment is a certain percentage of the fair market value that is determined by local assessors to be the total taxable value of land and additions on the property. | Land | Improvement |
|---|---|---|---|---|
| 2025 | $5,041 | $529,100 | $166,245 | $362,855 |
| 2024 | $5,051 | $534,050 | $171,942 | $362,108 |
| 2023 | $4,732 | $882,000 | $244,473 | $637,527 |
| 2022 | $4,483 | $453,750 | $127,618 | $326,132 |
| 2021 | $4,174 | $630,000 | $188,566 | $441,434 |
| 2020 | $4,005 | $580,000 | $175,699 | $404,301 |
| 2019 | $3,955 | $561,000 | $173,802 | $387,198 |
| 2018 | $3,736 | $532,000 | $165,908 | $366,092 |
| 2016 | $3,691 | $271,150 | $70,797 | $200,353 |
| 2015 | $3,180 | $221,760 | $70,797 | $150,963 |
| 2014 | $3,758 | $239,250 | $70,797 | $168,453 |
| 2013 | -- | $222,162 | $50,602 | $171,560 |
Source: Public Records
Map
Nearby Homes
- 133 Blue Sage Ln
- 1463 Stone House Bend Unit 405
- 1423 Stone House Bend Unit 403
- 1406 Stone House Bend Unit 413
- 1390 Orchard Ridge Ln
- 1494 Orchard Ridge Ln Unit 315
- 1202 E Mutton Hollow Rd
- 717 Woodridge Dr
- 378 N Thurston Ln
- 1048 N Kensington Heights
- 882 E Windsor Ln N
- 1285 E Grantham Way
- 2382 Summerwood Dr
- 2855 E Gentile St Unit 1
- 2867 E Mosley Ct N Unit 9
- 3100 E 1850 N
- 2851 E Mosley Ct N Unit 7
- 1039 N Mosley Ct E Unit 4
- 2885 E Mosley Ct N Unit 10
- 2848 E Mosley Ct N Unit 6
- 211 Cove Ln
- 173 Cove Ln
- 3301 Twin Peaks Dr
- 3301 Twin Peaks Dr Unit 29
- 3330 Twin Peaks Dr
- 3292 Cove Cir
- 3310 Twin Peaks Dr
- 119 Cove Ln
- 3311 Cove Cir
- 204 Cove Ln
- 3287 Cove Cir
- 3343 Cove Cir
- 170 Twin Peaks Cir
- 99 Cove Ln
- 3296 Twin Peaks Dr
- 3283 Twin Peaks Dr
- 124 Twin Peaks Dr
- 3353 Cove Cir
- 118 Twin Peaks Dr
- 102 Cove Ln
Your Personal Tour Guide
Ask me questions while you tour the home.