Estimated Value: $236,291 - $273,000
3
Beds
3
Baths
1,525
Sq Ft
$168/Sq Ft
Est. Value
About This Home
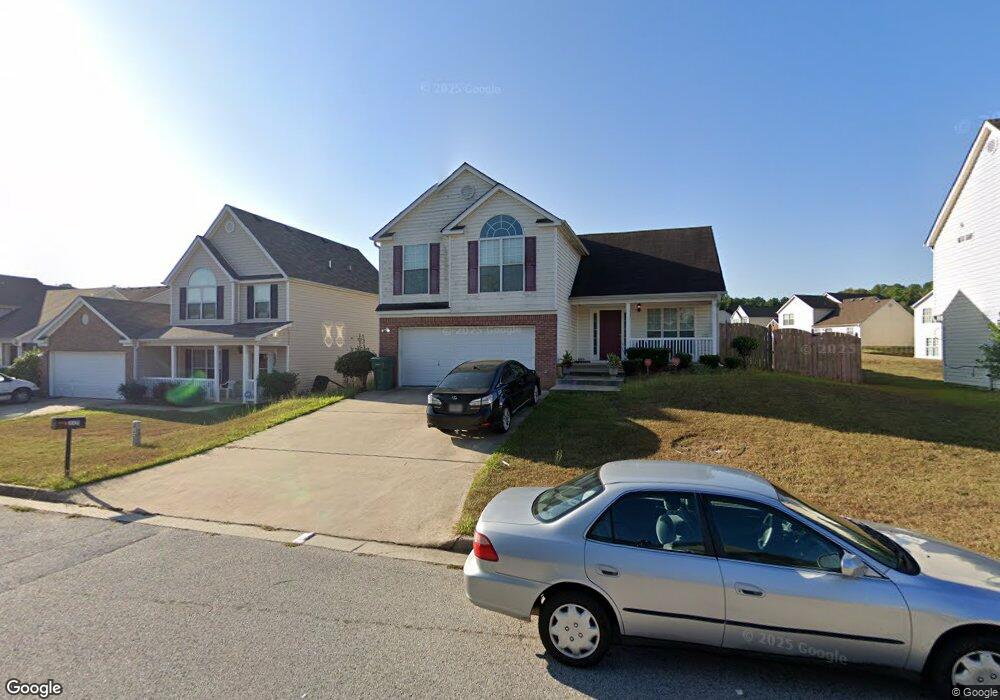
This home is located at 3321 Waggoner Place, Rex, GA 30273 and is currently estimated at $256,323, approximately $168 per square foot. 3321 Waggoner Place is a home located in Clayton County with nearby schools including East Clayton Elementary School, Adamson Middle School, and Morrow High School.
Ownership History
Date
Name
Owned For
Owner Type
Purchase Details
Closed on
Nov 13, 2017
Sold by
Rcm Fund 1 Owner Llc
Bought by
Cerberus Sfr Holdings Lp
Current Estimated Value
Purchase Details
Closed on
Feb 7, 2017
Sold by
Newman Tina
Bought by
Residential Capital Management
Purchase Details
Closed on
May 26, 2006
Sold by
Gt Architecture Contractors Co
Bought by
Newman Tina
Home Financials for this Owner
Home Financials are based on the most recent Mortgage that was taken out on this home.
Original Mortgage
$118,392
Interest Rate
6.95%
Mortgage Type
New Conventional
Purchase Details
Closed on
Mar 1, 2006
Sold by
Southside Dev Inc
Bought by
Gt Architecture Contractors Co
Home Financials for this Owner
Home Financials are based on the most recent Mortgage that was taken out on this home.
Original Mortgage
$908,936
Interest Rate
6.19%
Create a Home Valuation Report for This Property
The Home Valuation Report is an in-depth analysis detailing your home's value as well as a comparison with similar homes in the area
Home Values in the Area
Average Home Value in this Area
Purchase History
| Date | Buyer | Sale Price | Title Company |
|---|---|---|---|
| Cerberus Sfr Holdings Lp | $1,240,228 | -- | |
| Residential Capital Management | $80,500 | -- | |
| Newman Tina | $148,000 | -- | |
| Gt Architecture Contractors Co | $320,000 | -- |
Source: Public Records
Mortgage History
| Date | Status | Borrower | Loan Amount |
|---|---|---|---|
| Previous Owner | Newman Tina | $118,392 | |
| Previous Owner | Gt Architecture Contractors Co | $908,936 |
Source: Public Records
Tax History Compared to Growth
Tax History
| Year | Tax Paid | Tax Assessment Tax Assessment Total Assessment is a certain percentage of the fair market value that is determined by local assessors to be the total taxable value of land and additions on the property. | Land | Improvement |
|---|---|---|---|---|
| 2024 | $3,533 | $89,600 | $8,800 | $80,800 |
| 2023 | $3,273 | $89,600 | $8,800 | $80,800 |
| 2022 | $3,554 | $89,600 | $8,800 | $80,800 |
| 2021 | $2,155 | $53,600 | $8,800 | $44,800 |
| 2020 | $2,182 | $53,600 | $8,800 | $44,800 |
| 2019 | $2,214 | $54,751 | $8,800 | $45,951 |
| 2018 | $1,996 | $48,222 | $8,800 | $39,422 |
| 2017 | $1,696 | $40,740 | $8,800 | $31,940 |
| 2016 | $1,304 | $31,107 | $8,800 | $22,307 |
| 2015 | $1,189 | $0 | $0 | $0 |
| 2014 | $1,169 | $28,424 | $9,600 | $18,824 |
Source: Public Records
Map
Nearby Homes
- 3456 Heartland Dr Unit 2
- 3130 Rex Ridge Cir
- 3548 Meadowview Ct
- 6061 Tina Ln
- 5652 Laney Dr
- 5705 Laney Dr
- 5610 Swanson Rd
- 5631 Laney Dr
- 5810 Mistyview Dr Unit 3
- 5578 Swanson Rd
- 3078 Caliente Ln
- 6139 Katherine Rd
- 6103 Chaseland Dr
- 5861 Colonnade Dr
- 6103 Chaseland Rd
- 6057 Dorchester Dr
- 3694 Rex Rd
- 3645 Fay Dr Unit 1
- 3709 Charlotte Dr
- 3203 Pawnee Dr
- 3327 Waggoner Place
- 3315 Waggoner Place
- 3320 Waggoner Way
- 3326 Waggoner Way
- 3333 Waggoner Place
- 5991 Waggoner Ct
- 5997 Waggoner Ct
- 5997 Waggoner Ct Unit /172
- 3322 Waggoner Place
- 3328 Waggoner Place
- 3332 Waggoner Way
- 3316 Waggoner Place
- 6003 Waggoner Ct
- 5985 Waggoner Ct
- 3339 Waggoner Place
- 3334 Waggoner Place
- 3310 Waggoner Place
- 3338 Waggoner Way
- 3340 Waggoner Place
- 3345 Waggoner Place