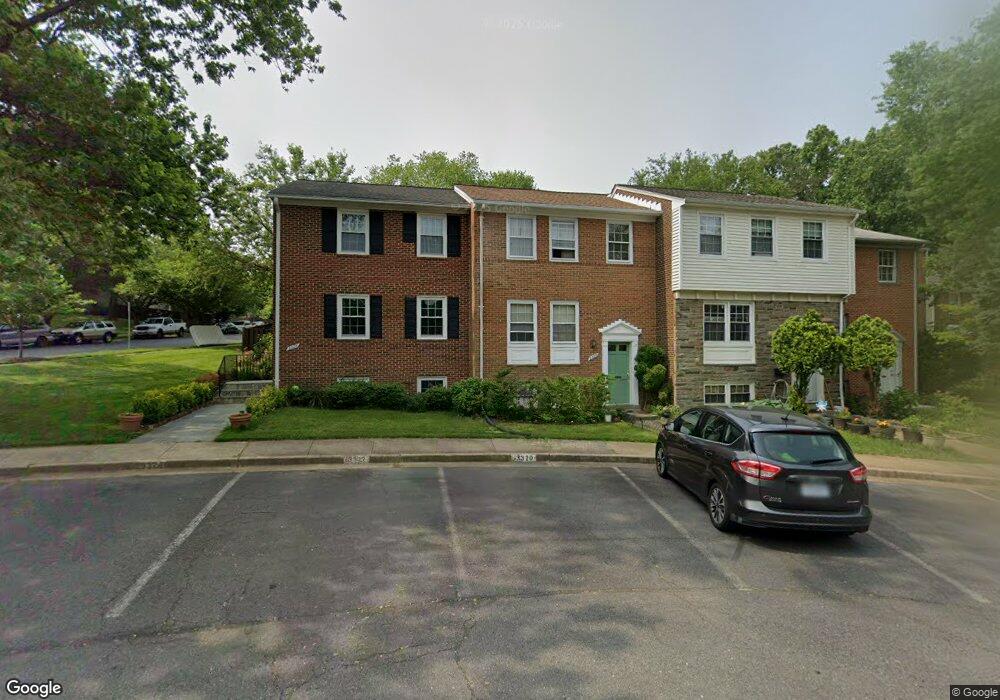
3322 Applegate Ct Annandale, VA 22003
Estimated Value: $551,000 - $599,000
3
Beds
4
Baths
1,302
Sq Ft
$441/Sq Ft
Est. Value
About This Home
This home is located at 3322 Applegate Ct, Annandale, VA 22003 and is currently estimated at $574,100, approximately $440 per square foot. 3322 Applegate Ct is a home located in Fairfax County with nearby schools including Camelot Elementary School, Luther Jackson Middle School, and Falls Church High School.
Ownership History
Date
Name
Owned For
Owner Type
Purchase Details
Closed on
Mar 31, 2006
Sold by
Sautters William H
Bought by
Devalladares Martha A M
Current Estimated Value
Home Financials for this Owner
Home Financials are based on the most recent Mortgage that was taken out on this home.
Original Mortgage
$351,960
Outstanding Balance
$201,792
Interest Rate
6.32%
Mortgage Type
New Conventional
Estimated Equity
$372,308
Purchase Details
Closed on
Aug 31, 2001
Sold by
White David L
Bought by
Sautters William H
Home Financials for this Owner
Home Financials are based on the most recent Mortgage that was taken out on this home.
Original Mortgage
$204,250
Interest Rate
7.06%
Purchase Details
Closed on
Apr 29, 1994
Sold by
Sumner Beverly
Bought by
White David L
Home Financials for this Owner
Home Financials are based on the most recent Mortgage that was taken out on this home.
Original Mortgage
$142,500
Interest Rate
7.7%
Create a Home Valuation Report for This Property
The Home Valuation Report is an in-depth analysis detailing your home's value as well as a comparison with similar homes in the area
Home Values in the Area
Average Home Value in this Area
Purchase History
| Date | Buyer | Sale Price | Title Company |
|---|---|---|---|
| Devalladares Martha A M | $439,950 | -- | |
| Sautters William H | $215,000 | -- | |
| White David L | $150,000 | -- |
Source: Public Records
Mortgage History
| Date | Status | Borrower | Loan Amount |
|---|---|---|---|
| Open | Devalladares Martha A M | $351,960 | |
| Previous Owner | Sautters William H | $204,250 | |
| Previous Owner | White David L | $142,500 |
Source: Public Records
Tax History Compared to Growth
Tax History
| Year | Tax Paid | Tax Assessment Tax Assessment Total Assessment is a certain percentage of the fair market value that is determined by local assessors to be the total taxable value of land and additions on the property. | Land | Improvement |
|---|---|---|---|---|
| 2025 | $6,002 | $553,620 | $180,000 | $373,620 |
| 2024 | $6,002 | $518,090 | $165,000 | $353,090 |
| 2023 | $5,584 | $494,850 | $155,000 | $339,850 |
| 2022 | $5,404 | $472,570 | $145,000 | $327,570 |
| 2021 | $5,029 | $428,550 | $135,000 | $293,550 |
| 2020 | $4,918 | $415,550 | $135,000 | $280,550 |
| 2019 | $4,797 | $405,360 | $130,000 | $275,360 |
| 2018 | $4,204 | $365,590 | $116,000 | $249,590 |
| 2017 | $4,245 | $365,590 | $116,000 | $249,590 |
| 2016 | $4,156 | $358,700 | $114,000 | $244,700 |
Source: Public Records
Map
Nearby Homes
- 3316 Woodburn Village Dr Unit 12
- 3331 Webley Ct
- 3328 Woodburn Village Dr Unit 14
- 8316 Tobin Rd Unit 8316-11
- 3362 Woodburn Rd Unit 13
- 8714 Duvall St
- 3006 Eskridge Rd
- 2993 Eskridge Rd
- 2973 Winter Jack Ln
- 3436 Holly Rd
- 8415 Spicewood Ct
- 8093 Gatehouse Rd Unit 2
- 7822 Holmes Run Dr
- 8058 Genea Way Unit 48
- 3021 Nicosh Cir Unit 1108
- 3116 White Daisy Place
- 2911 Charing Cross Rd Unit 16
- 2919 Fairhill Rd
- 2909 Charing Cross Rd Unit 6
- 2907 Charing Cross Rd Unit 14
- 3320 Applegate Ct
- 3324 Applegate Ct
- 3318 Applegate Ct
- 3316 Applegate Ct
- 3314 Applegate Ct
- 3312 Applegate Ct
- 3326 Conquistador Ct
- 3328 Conquistador Ct
- 3330 Conquistador Ct
- 3310 Applegate Ct
- 3332 Conquistador Ct
- 3308 Applegate Ct
- 3306 Applegate Ct
- 3334 Conquistador Ct
- 3304 Applegate Ct
- 3283 Victor Cir
- 3302 Applegate Ct
- 3300 Applegate Ct
- 3281 Victor Cir
- 3336 Conquistador Ct